April 25, 2024

John Paulson Remains Bullish On Gold With $4,000 Target

John Paulson, hedge fund titan, seemed invincible in the opening days of 2011.  Based on a huge bearish position in mortgage bonds, Paulson’s hedge funds earned an astonishing $15 billion during 2007.

Paulson’s winning streak continued for three years and by the end of 2010, Paulson’s success had attracted huge amounts of new investor money.   By the end of 2010, the amount of money under management in Paulson’s funds had swelled to  over $32 billion.  During 2010 Paulson personally made $5 billion and had become an investment legend.

No one, least of all John Paulson, could have imagined the disaster that was ready to unfold during 2011.  Paulson’s two largest funds got crushed during 2011 with the Paulson Advantage fund down 36% and the Paulson Advantage Plus fund down a staggering 52%.  Bad bets involving financial stocks and a large investment in Sino-Forest, a Chinese timber company, proved disastrous during 2011.

Although Paulson is well known for his long term bullish bets on gold this did not save him during 2011.  Despite a 10% increase in the price of gold during 2011, Paulson’s positions in gold stocks contributed to his losses  as gold shares dramatically underperformed gold bullion.

In a wide ranging interview with Bloomberg Businessweek, Paulson explained why 2011 turned out to be the year of pain for both himself and fund investors.

The firm had made four major mistakes, according to Paulson, “overweighting long event equity,” underestimating Europe’s debt crisis, overestimating the U.S. economy, and some plain-old terrible stock picking. “Our performance in 2011 was clearly unacceptable,” he wrote. “However, we believe 2011 will be an aberration in our long-term performance.”

Despite the huge losses of 2011, Bloomberg notes that Paulson still registered gains of $22.6 billion for investors over the lifetime of his funds, the third best in the hedge fund industry.

Paulson told Bloomberg that he considers 2011 an “aberration” and expects his long term strategies, including his large bet on the gold market to rack up large gains going forward.  During an interview in October 2010 at the University Club in New York, Paulson predicted that the price of gold would hit $4,000 per ounce.

Paulson explained his view on gold during the Bloomberg Businessweek interview as follows:

“We view gold as a currency, not a commodity,” Paulson says. “Its importance as a currency will continue to increase as the major central banks around the world continue to print money.” He adds that as the market keeps shuddering, demand for gold will stay high, and soon enough all of his depressed gold holdings should shoot up. He also thinks that anyone in Greece, Italy, and France should pull all their money out of the banking system and purchase gold bars before the Continent collapses.

Although Paulson remains committed to gold long term, he did substantially reduce his holdings in the SPDR Gold Shares ETF (GLD) during 2011.  At March 31, 2011, Paulson’s funds held 31.5 million shares of GLD valued at $4.4 billion but by the end of 2011, the position had declined to 17.3 million shares valued at $2.85 billion.   In Paulson’s latest Form 13-F filing with the SEC at March 31, 2012, Paulson’s position in the GLD remained unchanged from 2011 year end holdings.

GLD - courtesy yahoo finance

In hindsight, Paulson should have gone “all in” on gold during 2011 as he did with his bearish mortgage bets in 2007.  Gold closed at $1388.50 on the first day of trading in 2011 and closed the year at $1,531.  Had Paulson been 100% in gold bullion or the GLD during 2011 his portfolios would have increased in value by about 10.3%.
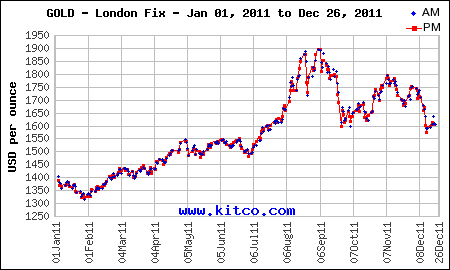
2011 Gold - courtesy kitco.com

Gold and Silver Bullion Coin Sales Rise In March

Production figures from the U.S. Mint for March show a sharp increase in the sale of both gold and silver bullion coins from the previous month.

Total sales of the American Gold Eagle bullion coins increased in March to 62,500 ounces, up from 21,000 ounces in February.  Total sales of the American Silver Eagle bullion coins totaled 2,542,000 ounces in March, up from 1,490,000 ounces in February.  Sales of both bullion coins for the first quarter of 2012, however, declined from the prior year.

Sales of the American Gold Eagle bullion coins totaled 210,500 ounces for the first quarter of 2012, down 29.7% from the 299,500 ounces sold in the first quarter of 2011.  Total sales of the American Silver Eagle bullion coins amounted to 10,139,000 ounces during the first quarter of 2012, down by 18.4% from the 12,429,000 ounces sold in the prior year’s first quarter.

The all time record year for sales of the American Gold Eagle bullion coins occurred in 2009 with 1,435,000 ounces sold.  The all time high record for sales of the American Silver Eagle bullion coins was in 2011 when a total of 39,868,500 one ounce coins were sold.

Gold Bullion U.S. Mint Sales By Year
Year Total Ounces Sold
2000 164,500
2001 325,000
2002 315,000
2003 484,500
2004 536,000
2005 449,000
2006 261,000
2007 198,500
2008 860,500
2009 1,435,000
2010 1,220,500
2011 1,000,000
2012 210,500
Total 7,460,000
Note: 2012 totals through March 31, 2012

The amount of physical gold bullion purchased purchased from the U.S. Mint over the past 12 years remains relatively small compared to the amount of gold invested in the two largest gold trust ETFs.  The SPDR Gold Shares ETF (GLD) is the world’s largest physically backed gold exchange traded ETF fund with current holdings of 41.4 million ounces of gold.  The iShares Gold Trust ETF (IAU) currently holds 6.2 million ounces of gold.

The total sales of gold and silver bullion coins detailed above do not include U.S. Mint gold and silver numismatic coin sales which are directly sold to the public.  American Gold and Silver Eagle bullion coins are only sold to a network of authorized purchasers  who in turn resell the coins to secondary retailers and the public.  The U.S. Mint decided that using  Authorized Purchasers to sell gold and silver bullion coins to the public was the most efficient means of selling the coins to the public at competitive prices.

Shown below are the U.S. Mint sales figures for the American Silver Eagle bullion coins since 2000.  Sales totals for 2012 are through March 31st.

American Silver Eagle Bullion Coins
YEAR OUNCES SOLD
2000 9,133,000
2001 8,827,500
2002 10,475,500
2003 9,153,500
2004 9,617,000
2005 8,405,000
2006 10,021,000
2007 9,887,000
2008 19,583,500
2009 28,766,500
2010 34,662,500
2011 39,868,500
2012 10,139,000
TOTAL 208,539,500

Gold Stocks Remain Frozen In Time

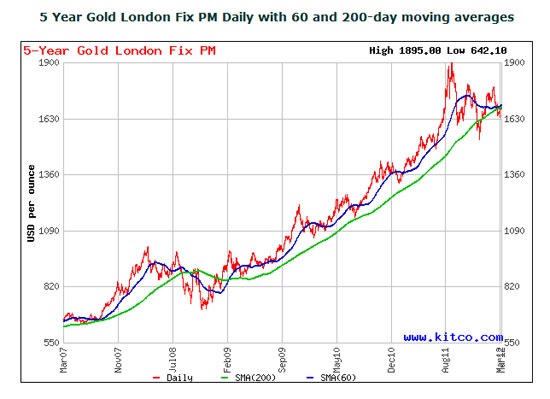
Investors in gold mining stocks have had a tough five years.  Since 2008, the price of most gold stocks have remained frozen in time even as gold bullion has doubled in price.  Is the disparity in price performance between gold stocks and gold bullion a bullish set up or another false dawn for gold stock investors?

Gold - courtesy kitco.com

The PHLX Gold and Silver Index (XAU), which is comprised of 16 major gold and silver producers, is no higher than it was during the last quarter of 2007.   The large cap gold stocks represented by the Market Vectors Gold Miners ETF (GDX) have shared the same fate with no gain for the past five years.

GDX - courtesy yahoo.com

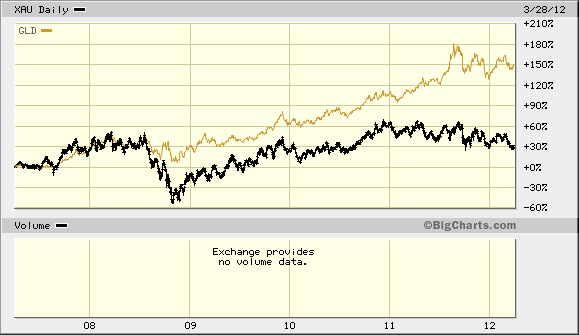
Beginning in 2011, the divergence between the price of gold bullion and gold stocks has widened even further.  Comparing the SPDR Gold Trust (GLD) to the PHLX Gold and Silver Index, we see that gold has dramatically outperformed gold stocks by a factor of five since early 2007.

XAU vs GLD - courtesy bigcharts.com

At this point, gold stocks are incredibly oversold and, in addition, represent sound fundamental value based on the price of gold bullion.  Given the notorious volatility of gold stocks, a move by gold above its high of last year could be the spark that ignites a huge rally in the gold stocks.

John Hathaway of the Tocqueville Gold Fund (TGLDX), who has produced fabulous investment returns over the past decade, had this to say in his latest Investment Update.

Gold and gold stocks appear to be bottoming in the wake of a four month correction which began in mid -August when the metal peaked at $1900/oz. Bearish sentiment is at extremes not seen in many years. This and a number of other indicators, such as stocks that have been hit by negative sentiment, the downtrend in gold prices since August, and tax loss selling, support our view that a rally lies ahead. This very bullish market set-up, in our opinion, mirrors the extraordinary investment opportunity of the despondent year end in 2007. Even though gold prices have been declining for several months, they finished the year with substantial gains. This suggests that the value represented by gold mining equities held in our portfolio could be extraordinary.

Disarray in Europe is, in our opinion, a slow motion version of the global market meltdown in 2007. It appears to us that the U.S. Fed is once again acting as the lender of last resort to European central banks in their efforts to save the euro. As in 2007, U.S. sovereign credit will be substituted for failing credits, in this case, peripheral European states. The fig leaf to justify such action on the Fed’s part is sado-fiscalism, or extreme austerity packages administered by technocrats. Tough restraints on profligate public spending, which has become a way of life in all Western democracies, will not go down easily. These measures are deflationary and will be ultimately met by howls of protests from mobs demanding renewed money printing and deficit spending. In our opinion, the fundamentals for gold are stronger than ever because the outlook for paper currencies is dire. The difficult correction of the last four months has shaken out all but the strongest holders, a perfect set-up for advances to new all-time highs in 2012.

Over the past ten years the Tocqueville Gold Fund has had an average annual return of 24%, far exceeding the 3% return by the S&P500.   The top ten holdings and percent of total assets of the Tocqueville Fund are listed below.

TGLDX Holdings

Gold Remains The Best Alternative To Paper Money

Two examples of the frustrations that some gold investors have gone through in the past year offers a valuable lesson to long term gold investors.

  1. During 2011, despite being heavily invested in gold, John Paulson’s Gold Fund wound up losing 11% of its value.  This despite the fact that gold bullion gained $142.50 during 2011, closing the year at $1,531.00, up 10.2% (see How Did An Investment Pro Lose Money Investing in Gold?).
  2. Investors in the $4.4 billion Vanguard Precious Metals Fund (VGPMX) which holds almost all of its assets in a diversified portfolio of precious metal mining stocks dropped by a stunning 27.4% last year, declining from $26.71 on January 3rd to $19.39 on December 30, 2011.

In both of the above cases, the declines in value were primarily due to the large under performance of gold stocks to gold bullion during 2011.  Nonetheless, nothing stings more than picking the right asset class only to somehow wind up losing.  An investor bullish on gold and investing completely in gold stocks would have had a disastrous year.  An investor with a large position in gold, diversified across gold mining stocks, gold bullion and gold ETFs would have performed substantially better.

Although gold stocks can often outperform gold bullion, many investors may lack the expertise to pick the best gold stock or gold mutual fund.  The best strategy for most small gold investors is to buy physical gold bullion at regular intervals with a commitment to a long term holding period.  Over the years, I have seen far too many uninformed investors who want a position in gold wind up trading speculative junior gold stocks, often times resulting in large losses.  Gold mining stock prices can be volatile and even when an investor selects quality gold stocks, the temptation to liquidate a position during  price weakness often results in losses.

The gold investor who has purchased gold bullion consistently over the past decade has been amply rewarded and there is no reason to expect this trend to change.

Meanwhile, John Paulson remains committed to gold and recently told Bloomberg News that he personally owns over half of the $1.2 billion Gold Fund he manages.

John Paulson, the hedge fund manager seeking to rebound from record losses in 2011, told investors his Gold Fund will outperform his other strategies over five years, according to a person with knowledge of the matter.

The billionaire, at a meeting yesterday at the Metropolitan Club in New York, said the metal is the best hedge against currency debasement as countries inject money into their economies, said the person, who attended the event and asked not to be named because the information is private. Paulson also cited gold as a hedge against the euro currency, as a breakup may occur, and an eventual increase in inflation.

The manager told clients his own money comprises 55 percent of the Gold Fund’s $1.2 billion in assets, the person said. The fund, which can buy derivatives and other gold-related securities, declined 11 percent last year after the metal slumped 14 percent in the final four months.

Europe’s sovereign-debt crisis may continue to affect bullion in the near term, Paulson, whose firm manages $23 billion, said this month in a year-end letter to investors. The metal serves as the best long-term alternative to paper currencies, he said.

“We remain excited about the outlook for the Paulson Gold Funds over the next few years,” he said in the letter. “We would argue that the potential upside in gold outweighs the potential downside.”

In addition to his Gold Fund, Paulson also holds a large position in the SPDR Gold Trust (GLD) ETF, valued at $2.9 billion.  As of February 24, 2011, the SPDR Gold Trust holds 41.3 million ounces of gold valued at $73.4 billion.

Gold and Silver ETF Holdings Decline On Week While Europe’s Debt Crisis Expands

The iShares Silver Trust (SLV) showed a decline in holdings of 48.21 tonnes from the previous week, after rising by 21.23 tonnes in the previous week.   The net outflow of the SLV since the start of the year now totals 1,389.17 tonnes.

Silver opened the year at $30.67 per ounce and closed at $35.38 on July 6th. Despite the fact that silver has gained 15.4% since the start of the year, SLV holdings have declined by 12.7%.  Although increases or decreases in iShares silver holdings can be a guide to silver demand, physical holdings of the SLV do not correlate exactly with the price movements on the underlying metal.  This is due to the complex structure of the SLV which allows authorized participants to create or redeem shares in the SLV (see How Wall Street Made Profits On Silver ETF As Small Investors Sold).

There was, however, a close correlation between holdings of the SLV and the price of silver in late April.  As silver prices surged to a high of $48.70 on April 28th, holdings of the iShares Silver Trust hit an all time high of 11,390.06 tonnes on April 25th.

The iShares Silver Trust currently holds 306.5 million ounces of silver valued at $10.84 billion.  The all time high value of silver holdings by the SLV was reached on April 28th when the Trust held silver valued at $17.3 billion.

The SLV moved up on the week and is basing in the mid 30’s range.


SLV - COURTESY YAHOO FINANCE

Holdings of the SPDR Gold Shares Trust (GLD) declined slightly on the week by 2.42 tonnes after a small decline in the previous week of .91 tonnes.  The decline in GLD gold holdings since the beginning of the year totals 74.91 tonnes. The price of gold has increased 10% from $1388.50 at the beginning of the year to yesterday’s closing price of $1527.25.

The GLD currently holds 38.8 million ounces of gold valued at $59.2 billion.

Gold moved up $32.25 this week after dipping below $1,500 last week.  As measured by the closing London PM Fix Price, gold closed on Wednesday at $1527.25.  Gold has refused to give up its gains this year as distrust of paper money continues to justifiably expand.  The inevitable default by multiple member states of the European Union will require massive monetary support for insolvent banks holding trillions of dollars of sovereign junk debt.   The European Central Bank is desperately trying to maintain the facade of a successful debt restructuring by issuing more loans to insolvent nations.

Bloomberg this week discusses the looming debt crisis in Italy which has over 2 trillion in Euro denominated debt.

Italy, though, has close to 2 trillion euros in debt outstanding. It’s inconceivable that Germany or the IMF could provide a rescue to protect its creditors. Such a package would have to involve loans and guarantees of at least 500 billion, and possibly 1 trillion, euros to impress the markets. This would be a significant fraction of Germany’s gross domestic product of about 2.5 trillion euros. With a debt-to-GDP ratio of about 80 percent, Germany’s ability to take on new debt is limited.

The Netherlands, Finland and Austria, combined with Germany, have a GDP of about 3.5 trillion euros. France adds 2 trillion more, but its debt, already 85 percent of output, is expected to grow over the next several years.

It all adds up to one sobering fact: Europe does not have enough fiscal firepower to handle an Italian crisis — at least in such a way as to protect creditors completely. Beyond the difficult numbers, why would Germany or other EU countries lend to Italy, particularly when its politicians show no sign of coming to grips with their new reality?

The slow motion collapse of overly indebted countries in Europe is picking up speed.  Rising gold prices reflect the coming financial crisis which equity and debt markets have not yet fully discounted.  Expect to see gold prices soar as the debt crisis moves into high gear.


GOLD - COURTESY KITCO.COM

GLD and SLV Holdings (metric tonnes)

July 6-2011 Weekly Change YTD Change
GLD 1,205.81 -2.42 -74.91
SLV 9,532.40 -48.21 -1,389.17


Gold And Silver ETFs Show Modest Decline In Holdings

The holdings of the iShares Silver Trust (SLV) declined slightly on the week by 53.10 tonnes as silver prices continued to consolidate after the sharp sell off of early May.

Since the beginning of the year, holdings have declined by 434.19 tonnes to the current level of 10,540.48 tonnes.  The all time record holdings of the SLV were 11,390.06 tonnes on April 25th, as the price of silver was approaching the $50 per ounce level.

Even after the early May pullback, silver has rewarded investors with a gain of 29.7% from the January low of $26.68.  The SLV has delivered a total return of 115.4% over the past year, and an average 25.8% yearly return since its inception in April 2006.

Despite the downturn in ETF holdings, there is strong evidence of continued strong fundamental demand for silver:

  • The U.S. Mint continues to ration sales of silver bullion coins, as total production cannot meet full market demand. This has led to higher premiums for American Silver Eagles and the newly introduced America the Beautiful Silver Bullion coins.
  • Dealers are reporting continued high demand for silver bullion as an increased number of new investors seek to protect their wealth by diversifying out of paper currency and existing investors use the reduced prices to increase holdings.
  • Investor demand for physical gold and silver is growing dramatically in countries such as India.  According to the Financial Times, silver traders in India report that “People are booking incredible amounts of Silver as they see the current drop in prices as a great opportunity to buy more…most are buying for pure investment.”

Meanwhile, the cheap money policies of the Federal Reserve are not likely to change any time soon.  Minutes of the last Fed meeting on April 27-28th, indicate that the Fed extensively discussed an exit strategy from its easy money policies but provided no guidance on timing.  Most analysts have concluded that it may be years before the Fed actually starts to tighten monetary policy.

GLD and SLV Holdings (metric tonnes)

May 18-2011 Weekly Change YTD Change
GLD 1,191.34 -9.70 -89.38
SLV 10,540.48 -53.10 -434.19

Holdings in the SPDR Gold Shares Trust (GLD) declined slightly on the week by 9.7 tonnes.  It was disclosed this week that investor George Soros sold 4.7 million shares of the GLD during the first quarter, bringing his holdings down to a token 49,400 shares.  The liquidated shares were valued at $684 million based on today’s closing price of the GLD.  The 4.7 million shares of GLD represented only approximately 15 tonnes of gold or 1.2% of total GLD holdings.

Was Soros turning negative on gold, as suggested by the media, or was Soros simply taking some short term profits?  While Soros was selling, legendary hedge fund manager John Paulson did not reduce his massive stake of $4.4 billion in the GLD.  Although Soros has a great long term track record, during the financial panic of 2007-2008, he bought Countrywide and Lehman Brothers shortly before they collapsed.  Perhaps history will repeat and the sale of gold by Soros will mark a major bottom in the gold market.

The long term uptrend in gold is still intact and supported by the fundamentals (see Insights From A Legendary Gold Investor).   Since the SPDR Gold Shares inception date of November 12, 2004, the fund has had a spectacular annual average return of 19.6%.  The GLD currently holds 38.3 million ounces of gold valued at $57.3 billion.


Silver And Gold ETFs Stable – Bank Savings vs. Precious Metals and How Much Is a Trillion?

As the silver market stabilized after last week’s sell off, holdings of the iShares Silver Trust (SLV) increased by 153.22 tonnes over the past week.
Since the beginning of the year, the SLV holdings have declined by 381.09 tonnes, but the largest decrease in holdings tracks the silver sell off that began in late April.  From a record high holding of 11,390.06 tonnes of silver on April 25th, the SLV has seen a decline in holdings of 849.58 tonnes.   The reduction of holdings since April 25th exceeds the amount of silver originally held by the SLV at its inception in April 2006 when it held 653.17 tonnes.

One indication of the amount of forced selling that occurred last week is reflected by the premium/discount on the SLV compared to its net asset value.  On April 25th, when the SLV had peak holdings and silver was surging towards the $50 level, the premium on SLV shares was 1.48%.  Investors at that point were paying $45.83 per share while the SLV’s net silver assets were $45.14.  Two days later and trading at very high volume, investors paid $47 per share for the SLV which held silver worth $44.20, a fat premium of 6.29%.

The first week of May saw a steep price decline in silver caused, in large part, by five margin increases by the COMEX on silver futures trading (see How The Comex Crashed The Silver Market).  Forced selling of the SLV resulted in huge discounts from net asset value.  On May 2nd, the discount on the SLV reached a huge 9.87% and sellers of the SLV were receiving only $42.79  for shares with a net asset value of silver worth $47.51.  On Monday and Tuesday of this week, pricing became orderly with only a minor difference between net asset value and market value of the SLV.

The SLV currently holds 338.9 million ounces of silver valued at $13.3 billion.  Despite the recent sell off, silver has had a spectacular performance this year.   From its January low of $26.68 to its closing New York spot price on May 11th of $35.27, silver has risen by 32%, proving the case for diversification into precious metals.

By contrast, savers of paper currency in banks have been treated to returns of virtually zero, courtesy of Ben Bernanke’s zero interest rate policies.  As the public wakes up to the fact that their paper currency savings are becoming worth less and less, the demand for both gold and silver should increase exponentially.

GLD and SLV Holdings (metric tonnes)

May 11-2011 Weekly Change YTD Change
GLD 1,201.04 -18.90 -79.68
SLV 10,540.48 +153.22 -381.09

Holdings of gold by the SPDR Gold Shares Trust (GLD) declined by 18.90 tonnes on the week.  The GDL currently holds 38.6 million ounces of gold valued at $58.2 billion.

How Much Is A Trillion?

Sometimes a very routine event can open your eyes and keep you on the right long term track.  Last week I was having breakfast in Mexico and casually put a tip of a couple of U.S. dollars on the table.  (Yes, they still take our paper money in Mexico).   Gazing at the paper dollars I reflected on how, as a child, two hours of working odd jobs for neighbors would earn me two dollars.

Then, I tried to figure out how big the table would have to be to hold the $2 trillion dollars printed out of thin air by the Federal Reserve over the past couple of years.   At this point, my wife started getting annoyed with me, so I gladly restrained myself from an academic exercise that was fruitless anyways.   How many people can comprehend a trillion dollars?  Not me, but I know it’s a crazy large amount.  I also know that anything that can be produced in the trillions at virtually no cost cannot have any real long term fundamental value.  And that’s all I really need to know to make me indifferent to a short term sell off in the gold and silver markets.

Silver and Gold ETF Holdings Decline Amidst Volatile Trading

In a week of volatile precious metals trading, holdings of both the iShares Silver Trust (SLV) and the SPDR Gold Shares Trust (GLD) saw modest declines.
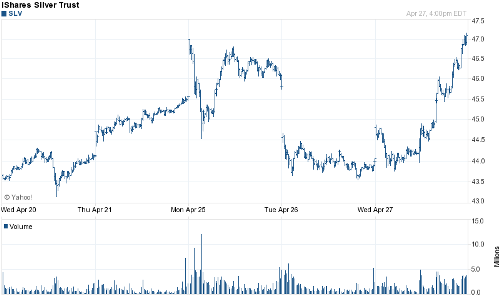
The holdings of the SLV declined by 130.49 tonnes or 1.2% from last week to 11,053.20 tonnes.  Looking at the daily changes, however, provides a a better indication of the volatility in SLV holdings during the week.

The holdings of the SLV hit an all time record high amount of 11,390.06 tonnes on Monday April 25th.  The substantial decline of 336.86 tonnes over the following two days mirrors the volatile price action of the SLV, which declined more than $2 on Tuesday before recovering to all time  highs at Wednesday’s closing price.

SLV - COURTESY YAHOO FINANCE

The SLV currently holds 355.4 million ounces of silver valued at $16.1 billion.  The SLV is currently the largest silver ETF and has seen tremendous growth in holdings since the Trust’s inception in April 2006, when it held a mere 653.17 tonnes valued at $263.5 million.  According to the Silver Institute, at the end of the first quarter 2011, total holdings held by all silver ETFs was 612 million ounces.

Despite the tremendous appreciation of the SLV, the silver market remains a relatively small market which leads to speculation that silver prices are being manipulated.  Volatility in silver trading over the past week was enhanced by rumors of massive short positions by traders, attempts to corner the market by larger players, and the inability to deliver physical silver on futures contracts.

The recent volatility in silver is likely to continue as additional players are drawn into one of the hottest markets of 2011 and wide price swings may become the norm over the short term.

For long term  investors, the fundamentals of the silver market should overweight any short term volatility.  Sales of Silver Eagles by the US Mint in the first quarter of 2011 was 37% higher than the previous year reflecting continuing investor demand.

GLD and SLV Holdings (metric tonnes)

April27-2011 Weekly Change YTD Change
GLD 1,229.64 -0.61 -51.08
SLV 11,053.20 -130.49 +131.63

Gold holdings in the GLD declined modestly by 0.61 tonnes after an increase of 17.29 tonnes for the previous week.  The current holdings of the GLD amount to 39.5 million ounces of gold valued at $59.7 billion.

Gold hit another all time high today, recently trading at $1,531.  The Federal Reserve ignited a sharp rally in gold and silver after releasing details of this week’s FOMC meeting. The precious metal markets moved higher after the Federal Reserve said it would continue super aggressive monetary policies despite the June wind down of QE2.  The Fed indicated that it would not reduce the size of its balance sheet and would leave short term interest rates at zero.

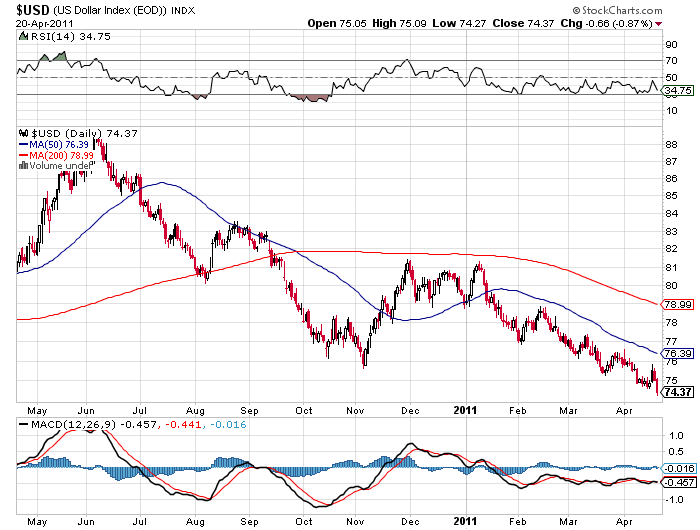
The Fed also left the door open to future unconventional policy moves if deemed necessary.  Since the Fed cannot move rates below zero, any additional “unconventional easing” would almost certainly mean additional money printing by the Fed.   The US dollar traded lower on Fed comments and is now threatening to break to new all time lows.


iShares Silver Trust and SPDR Gold Trust Holdings Increase As Worries Over Paper Money Grow

Both the iShares Silver Trust (SLV) and the SPDR Gold Shares Trust (GLD) saw holdings jump on the week as precious metal prices continued to climb.
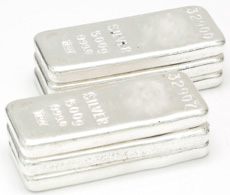
The holding of the SLV increased by a substantial 213.98 tonnes over the past week after posting a decline of 192.74 tonnes in the previous week.  The all time record holdings of the SLV was reached on April 11, 2011, at 11,242.89 tonnes.

Strong investment and fundamental demand for silver continued to push silver prices higher with the London PM Fix Price for silver closing yesterday at $44.79, up from $40.22 a week ago.

While some analysts worry about the “inflation” in silver prices, the world’s most successful investor is worried about dollar inflation.  Warren Buffet – “We’re following policies that will lead to a lot of inflation down the road unless changes are made”.  The U.S. can’t “run the kind of deficits we’re running and other policies…without it being enormously inflationary”.

The SLV currently holds 359.6 million ounces of silver bullion valued at $16.1 billion.  The SLV has seen seen an astonishing increase in the value of its holdings.  At the Trust’s inception in April 2006, silver holdings of 653.17 tonnes were valued at $263.5 million.

GLD and SLV Holdings (metric tonnes)

20-April-2011 Weekly Change YTD Change
GLD 1,230.25 +17.29 -50.47
SLV 11,183.69 +213.98 +262.12

Gold holdings of the SPDR Gold Shares Trust increased on the week by 17.29 tonnes to a total of 1,230.25 tonnes, after an increase of 7.49 tonnes in the previous week.  The GLD now holds a total of 39.6 million ounces of gold valued at $59.4 billion.

Gold continued to gain this past week and, as measured by the London PM Fix Price, closed yesterday at an all time high of $1,501.00.  Gold has gained $43.50 over the past week and since the beginning of the month is up $83 per ounce or 5.8%.

The price gains in gold continue to confound the numerous skeptics of the golden metal who can’t understand why gold is going up in the absence of high rates of inflation.  Perhaps the skeptics should pay attention to the increasingly vocal concerns by governments holding large reserves of U.S. dollars and whose economies are being harmed by the flood of rapidly depreciating U.S. dollars.

COLLAPSING US DOLLAR - COURTESY STOCKCHARTS.COM

Nyet to diplomacy. In extremely blunt remarks, Russian Prime Minister Vladimir Putin, commenting after the S&P downgrade on the U.S. debt outlook, said:  “Look at their (the U.S.) trade balance, their debt and budget.  They turn on the printing presses and flood the entire dollar zone – in other words, the whole world, with government bonds.  There is no way we will act this way anytime soon.  We don’t have the luxury of such hooliganism”.   Nor is Mr. Putin simply talking tough – the Russian government is also acting to protect its financial interests by reducing their holdings of U.S. treasury debt.  Russia, the world’s third largest holder of U.S. debt has been greatly reducing its dollar holdings this year.

China, the world’s largest holder of U.S. dollars totaling a massive $3 trillion, has been expressing its frustrations and concerns with U.S. monetary policy for years.  A plunging US dollar reduces the value of US debt held by China.  To offset the losses from holdings US paper assets, China has been reducing its holdings of U.S. dollars and buying physical assets worldwide.  China also took major steps this week to gradually implement full convertibility of the yuan in world markets which would allow it to hold fewer US dollars.

Governments worldwide are taking major steps to reduce loss exposure from holding US dollars that can be printed in the trillions by the U.S. Federal Reserve.  In another sign of disgust towards U.S. fiscal and monetary policies,  Brazil, Russia, India, China, and South Africa recently agreed to use their own currencies among themselves instead of the U.S. dollar.

The result of ultra loose U.S. monetary policies, huge budget deficits and money printing by the Federal Reserve have all contributed to the flight to wealth preservation as reflected by a collapsing US dollar and skyrocketing precious metals prices.

iShares Silver Trust Holdings Decline

The iShares Silver Trust (SLV) saw silver holdings slump on the week while holdings of the SPDR Gold Shares Trust (GLD) increased.
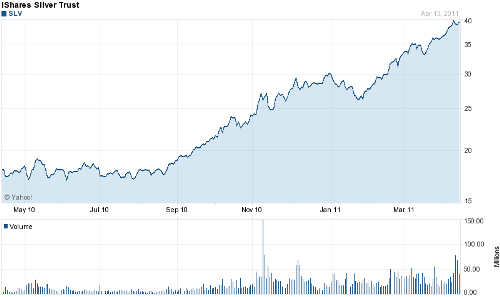
SLV holdings dropped by 192.74 tonnes on the week after adding 22.93 tonnes in the previous week.  Total holdings of the SLV amount to 10,969.71 tonnes or 352.7 million ounces of silver valued at $14.2 billion.  There is not always a direct correlation between the movement in silver prices and the amount of silver held by the trust.  For example, the total silver holdings of the SLV have increased by only .4% since the start of the year, while silver prices have increased by 32% over the same period.

There is a direct correlation between the price of the SLV and the price of silver.  The iShares Silver Trust was structured to track the price movement in silver bullion and it has achieved that result.  Since the inception of the SLV in April 2006, the annualized total return of the SLV has been 25.17% compared to an annualized total return for silver of 25.79%, the difference being primarily attributable to sponsor fees of .5% a year.

GLD and SLV Holdings (metric tonnes)

13-April-2011 Weekly Change YTD Change
GLD 1,212.96 +7.49 -67.76
SLV 10,969.71 -192.74 +48.14

The SLV has experienced a huge long term increase in silver holdings based on investor demand.  Since the inception of the trust in April 2006, total holdings of the SLV have exploded by almost 1,600% from 653.17 tonnes to the current total of 10,969.71 tonnes.

Silver experienced price volatility during the past week but ended up $.59 per ounce at Wednesday’s close from the prior week.  Earlier in the week, silver saw a brief pullback from its highs as investors took profits in the commodity sector.  In addition, the silver market was spooked by word of an investor taking a large bearish options position in the May SLV put contracts.

SLV - COURTESY YAHOO FINANCE

Holdings of the GLD increased by 7.49 tonnes on the week.  The GLD currently holds 1,212.96 tonnes or 39.0 million ounces of gold valued at $56.8 billion.  As measured by the London PM Fix Price, gold declined by a modest $4 per ounce from its April 6th closing price.

GFMS,  a prestigious metals consulting firm based in London,  issued a bullish forecast for gold prices during 2011.  Barring a major rise in interest rates or a strong rally in the US dollar, GFMS is predicting that gold will reach $1,600 per ounce by the end of the year.  GFMS based its bullish forecast on very easy monetary policies, surging rates of inflation in Asian economies and continuing investment demand for gold.