April 18, 2024

Why The Long Term Price of Silver Is Guaranteed To Rise

By: GE Christenson

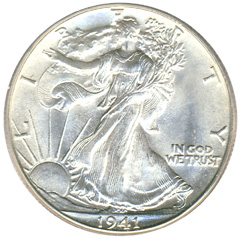
Walking-Liberty-HalfBegin the analysis in 1971 when Nixon dropped the link between the dollar and gold. A pack of Marlboros cost (depending on local taxes) about $0.39. We paid about $0.36 for a gallon of gasoline. The DOW Index was about 850. Silver was priced at about $1.39.

Times have changed! Read Part 1 of Silver – Keep It Simple!

Today we have more currency in circulation, far more debt, and much higher prices – what does it mean?

Examine Graph 1. The prices for retail cigarettes, crude oil, national debt, silver, and the true money supply (TMS) (see notes at end) are shown on a log scale graph with all prices normalized to start at 1.0 in 1971.

Click on image to enlarge.
  • National debt (green line) has increased rapidly since 1971 and even more rapidly, on average, than the other items. (National debt has increased over 12% per year for the last five years.)
  • Silver (black line) and crude oil (red line) prices have been erratic with peaks in the early 1980s, troughs in the late 1990s, and substantial rises since 2001.
  • Cigarettes and TMS have increased steadily since 1971.
  • TMS (also M2, M3, etc.), debt, and most commodity prices have increased exponentially since 1971. Because the dollar was not backed by gold, dollar creation, total debt, and prices increased rapidly.
  • Not shown are some prices that increased more rapidly (medical costs and college tuition) and some that increased more slowly (postage and bread).

Graph 2 shows annual silver and crude prices smoothed with a centered five period moving average. This removes much of the “noise” in the price data and shows longer term trends better. Note that the price of silver actually reached about $50 per ounce in early 1980, but the average daily price in 1980 was only $16.39; the smoothed daily average was about $11.

Click on image to enlarge.

Statistical Correlations

  • Silver prices in dollars (annual average of daily price) correlated with crude prices in dollars (annual average of daily price) at 0.83 – a good correlation. Both are commodities, both are affected by politics, and both are sensitive to money supply, actual inflation, and inflationary expectations.
  • TMS correlated with national debt at 0.99 – a tight correlation. When budget deficits increase the national debt, the money supply expands accordingly.
  • Silver prices (annual average shown) correlated with national debt at 0.67 and with TMS at 0.58. The smoothed silver price correlation to national debt was 0.76 over 40 years and much higher over the past 13 years.
  • Silver prices (smoothed) correlated with crude prices (smoothed) at 0.93 – an excellent correlation.

So What?

  • National debt correlates tightly with TMS. Smoothed silver prices correlate well with both national debt and TMS. We may be apprehensive about future silver prices, but we can be 99.99% certain about the inevitable increase in national debt. Based on the 40 year correlation between silver and national debt, silver prices will continue to rise.
  • Both crude oil and silver are commodities that experience large price volatility. On average, they go up and down together; and, over a 40 year history, their prices have clearly moved substantially higher. I see many reasons to expect both to move higher in the long term.
  • Crude oil is the most important commodity in the world. Its per capita use, on average, is rising and the world’s population is increasing, so demand will remain strong, unless the world suffers a massive financial and economic collapse. Further, the easily available oil has been taken so there is little chance that inexpensive supply will increase. More demand coupled with flat or declining supply requires higher future prices. Higher crude oil prices strongly suggest higher silver prices.
  • Central banks are “printing money” in their desperate attempt to fight deflation, levitate asset prices, bailout banks and countries, and encourage inflation. This guarantees further increases in national debt and TMS and price increases for most commodities including crude oil, cigarettes, and silver.

Price of Silver as a Projection Based on Other Variables

We can construct a calculated price for silver based on three variables – national debt, TMS, and the price of crude oil. Examine Graph 3 of smoothed silver prices and the calculated price of silver based on those three variables. Note that the correlation is 0.86 – quite good. The silver price has both a monetary component (national debt and TMS) and a commodity component (crude oil). Together they produce a simple but effective projection for the smoothed average price of silver over the past 42 years.

Click on image to enlarge.

For the Future

Assume national debt increases 12% per year for the next five years like it has for the past five years. Assume TMS and crude continue their past five year growth rates (11% and 8%). The estimated price for the smoothed average price of silver is about $55 in 2016. The peak price on a spike higher could easily be triple the smoothed price. Look for $100 silver in 2015 – 2017 unless a deflationary collapse occurs – to the detriment of everyone including banks, politicians, and national governments.

Conclusion

Debt, money supply, and the prices for most commodities have exponentially increased over the past 42 years. Prices for crude oil and silver have substantially increased but inconsistently. I can be certain of death and taxes, and I feel confident that the national debt and prices for crude oil, cigarettes, silver, and most other consumer items will drastically increase in the next few years – under circumstances similar to the past 40 years. A hyperinflationary increase is also possible, in which case, all commodity prices will be unbelievably higher. Assuming no deflationary collapse, expect $100 silver relatively soon – perhaps in 2016. Read Past & Future Speculative Bubbles – What They Indicate for Gold and Silver!

GE Christenson
aka Deviant Investor

Gold At $10,000 – Silver At $400 – Here’s How It Will Happen

By GE Christenson:

This is not a prediction of future prices of gold and silver; it is an indication of what could happen in a speculative bubble environment based on the history of previous bubbles.

I’ll summarize a simple analysis of past bubbles.

Definitions

    • Bubble: A speculative mania in a market that is priced well beyond what the fundamentals and intrinsic value indicate.
    • Phase 1: The first phase of the bubble begins with the price bottoming and initiating a long rally. It is often indicated by a triggering event such as Nixon closing the “gold window” on August 15, 1971 – the beginning of the gold and silver bubbles that terminated in 1980. The market rallies for some years, hits a new “all-time” high, and then corrects.

When the market proceeds into a bubble phase, it rallies beyond that new high and continues much higher. The end of phase 1 and the beginning of phase 2 are the point at which the market rallies from its correction low and exceeds its previous high. See the graph of the silver market with the indicated beginning and end points for phase 1 and phase 2.

  • Phase 2: The final phase of the bubble starts when the price exceeds the “new high” and then rallies to a much higher and unsustainable level.

Click on image to enlarge.

I looked at the time and price data for the South Sea Bubble in England from 1719 -1720, the silver bubble from August 1971 to January 1980, the NASDAQ bubble from August 1982 to March 2000, the Japanese Real Estate bubble from 1965 to 1991, the gold bubble from August 1971 to January 1980, and the S&P mini-bubble from August 1982 to March of 2000. A spreadsheet will not display well, so I’ll list my results. Please realize that all prices and dates are approximate – this is “big picture” analysis.

The conclusion is that bubbles start slowly and then accelerate to unsustainable highs (on large volume) that are largely created by greed and fear but not fundamental evaluations. Bubbles generally follow the “Pareto Principle” where approximately 80% of the price move occurs in the LAST 20% of the time. Consider:

South Sea Bubble: (Extreme price bubble)

  • Phase 1: January 1719 to March 1720. Price from $120 to $180.
  • Phase 2: March 1720 to July 1720. Price from $180 to $900.
  • Time: Phase 1 – 75%, phase 2 – 25%.
  • Price: Phase 1 – 8%, phase 2 – 92%. Phase 2 price ratio: 5

Silver Bubble: (Extreme price bubble)

    • Phase 1: August 1971 to March 1978. Price from $1.50 to $6.40.
    • Phase 2: March 1978 to January 1980. Price from $6.40 to $50.
    • Time: Phase 1 – 78%, phase 2 – 22%.
    • Price: Phase 1 – 10%, phase 2 – 90%. Phase 2 price ratio: 7.8


NASDAQ Bubble: (Extreme price bubble)

    • Phase 1: August 1982 to February 1995. Price from $168 to $780.
    • Phase 2: February 1995 to March 2000. Price from $780 to $4,880.
    • Time: Phase 1 – 71%, phase 2 – 29%.
    • Price: Phase 1 – 13%, phase 2 – 87%. Phase 2 price ratio: 6.3


Japanese Real Estate Bubble: (approximate numbers)

    • Phase 1: 1960 to 1979. Price Index from 4 to 50.
    • Phase 2: 1979 to 1991. Price Index from 50 to 225.
    • Time: Phase 1 – 61%, phase 2 – 39%.
    • Price: Phase 1 – 21%, phase 2 – 79%. Phase 2 price ratio: 4.5


Gold Bubble:

    • Phase 1: August 1971 to July 1978. Price from $40 to $200.
    • Phase 2: July 1978 to January 1980. Price from $200 to $870.
    • Time: Phase 1 – 82%, phase 2 – 18%.
    • Price: Phase 1 – 19%, phase 2 – 81%. Phase 2 price ratio: 4.4


S&P Bubble: (Mini-bubble)

    • Phase 1: August 1982 to February 1995. Price from $100 to $483.
    • Phase 2: February 1995 to March 2000. Price from $483 to $1,574.
    • Time: Phase 1 – 71%, phase 2 – 29%.
    • Price: Phase 1 – 26%, phase 2 – 74%. Phase 2 price ratio: 3.3


Summary

Bubbles tend to follow the 80/20 ratio indicated in the Pareto Principle. Phase 1 takes approximately 70-80% of the time and covers approximately 10-20% of the total price change. Phase 2 accelerates so that it takes only 20-30% of the time but covers 80-90% of the price change. Extreme bubbles such as the South Sea Bubble and the Silver bubble experience approximately 90% of the price change in the 2nd phase. The ratio of the phase 2 ending price to beginning price is typically 4 to 8 – a huge price move. Such bubbles are rare; the subsequent crash is usually devastating.

Future Bubbles

In the opinion of many analysts, sovereign debt is an ongoing bubble that could burst with world-wide consequences. Should deficit spending and bond monetization (Quantitative Easing) accelerate in the next several years, as seems likely, that sovereign debt bubble will inflate further. Because of the massive printing of dollars, the value of the dollar must fall, particularly against commodities such as oil, gold, and silver. As the purchasing power of the dollar falls, an increasing number of people will realize their dollars are losing value, and those people will seek safety for their savings and retirement. Gold and silver will benefit from an increasingly desperate search for safety as a result of the decline of the dollar. Assuming the 80/20 “rule” and the phase 2 price change ratio of approximately 5, what could happen if gold and silver rise into another speculative bubble?

Assume that silver began its uptrend in November 2001 at $4.01 and that gold began its move in April 2001 at $255. Silver rallied to nearly $50 in 2011, and gold also rallied to a new high of about $1,900 in 2011. Assume that both surpass those highs about mid-2013 and accelerate into phase 2 thereafter. Using these assumptions, phase 1 for silver would measure 12.5 years and phase 2 could last until approximately late 2016 – early 2017. If we assume that phase 1 was a move from $4 to $50 and that represents 19% of the total move, the high could be around $250. The ratio of phase 2 ending price to beginning price would be 5:1 – reasonable.

Indications for gold suggest a similar end date and a phase 2 bubble price of perhaps $9,000 per ounce. The ratio of phase 2 ending price to beginning price would be 4.7:1 at $9,000.

The gold to silver ratio at these bubble prices would be approximately 36, much higher than the ratio from 1980. Perhaps silver would “blow-off” higher, like it did in 1980, and force the gold to silver ratio lower or perhaps gold might not rally so high. Time will tell.

Outrageous?

Well, yes, at first glance, those prices do seem outrageous. But consider for perspective:

  • Apple stock rose from about $4 in 1997 to over $700 in 2012.
  • Silver rose from $1.50 to $50.00 in less than 10 years.
  • Gold rose from about $40 to over $850 in less than 10 years.
  • Crude oil rose from less than $11 in 1998 to almost $150 in 2008.
  • The official US national debt is larger than $16,000,000,000,000. The unfunded liabilities, depending on who is counting, are approximately $100,000,000,000,000 to $230,000,000,000,000. Divide $200 Trillion by approximately 300,000,000 people and the unfunded debt per capita of the United States is approximately $700,000. That is outrageous!
  • The official national debt increases in excess of $3,000,000,000 per day, each and every day. The unfunded liabilities increase by perhaps five – ten times that amount. Outrageous!
  • We still pretend the national debt is not a problem and that it will be “rolled over” forever. That is outrageous.
  • Argentina has revalued their currency several times in the last 30 years – they have dropped 8 zeros off their currency since 1980. Savings accounts and the middle class were devastated several times. It can happen again.

Given the above for perspective, is gold at $5,000 to $10,000 per ounce unreasonable or impossible? Is silver at $200 to $400 per ounce unreasonable or impossible? Past bubbles have had an ending price 4 – 8 times higher than the phase 2 beginning price, so history has shown that such prices for gold and silver are indeed possible. Possible is not the same as certain – but these bubble price indications are certainly worth your consideration.

Would you prefer your savings in gold, silver, or a savings account? Read Ten Steps to Safety.
GE Christenson
aka Deviant Investor
Why Silver Will Hit $100

By GE Christenson

There are many predictions for the price of silver. Some say it will crash to nearly $20, and others proclaim $100 by the end of 2012. The problem is that some predictions are only wishful thinking, others are obvious disinformation designed to scare investors away from silver, and many are not grounded in hard data and clear analysis. Other analysis is excellent, but both the process and analysis are difficult to understand. Is there an objective and rational method to project a future silver price that will make sense to most people?

Yes, there is!

I am not predicting a future price of silver or the date that silver will trade at $100, but I am making a projection based on rational analysis that indicates a likely time period for silver to trade at $100 per ounce. Yes, $100 silver is completely plausible if you assume the following:

  • The US government will continue to spend in excess of $1 Trillion per year more than it collects in revenue, as it has done for the previous four years, and as the government budget projects for many more years.
  • Our financial world continues on its current path of deficit spending, debt monetization, Quantitative Easing (QE), weaker currencies, war and welfare, ballooning debts, and business as usual.
  • A massive and devastating financial and economic melt-down does NOT occur in the next four to six years. If such a melt-down occurs, the price of silver could skyrocket during hyperinflation or stagnate under a deflationary depression scenario.

Still with me? I think most people will accept these simple and rather obvious assumptions.

Many individuals find it difficult to believe any projections for silver, either higher or lower, because silver is hated, loved, often ignored, and seldom recognized as another currency. However, most people know that the US government national debt is huge and will grow much larger during the next decade. Examine the following graph:

Click on image to enlarge.

National debt is plotted on the left axis – yes, it was larger than $16 Trillion as of September 30, 2012. Silver is plotted on the right axis. The data covers an 11 year span from September 2001 through September 2012. This period includes the time after the stock market crash of 2000, the game-changing events of 9-11, the real estate crash, and the new bull market in commodities. Each month represents one data point. Note the similarity between the two trends. The statistical measure R-Squared for this 11 year period of monthly data is 0.838 – quite high. R-Squared increases to about 0.90 if national debt is correlated to the monthly price of silver after it has been smoothed with 9 month moving average.

This expansion in the national debt is a simple proxy for expansion of the money supply and the devaluation of the dollar. The exponential growth rate for the national debt averaged over this period is 9.7% compounded annually, while the rate averaged over the last five years is 12.3%. The exponential growth rate for silver is a bit larger – about 20% per year compounded annually. I attribute this larger rate, in excess of 12.3%, to the realization that silver is a competing currency, mining supply is growing slowly, most governments are aggressively “printing money,” industrial demand is increasing, and some investors are actively buying silver. In short, demand is increasing while the realization that silver is still an undervalued investment and cannot be “printed” at will (like dollars and euros) has reached the awareness of individual investors. I believe it is very likely that national debt and the price of silver will continue their 11 year exponential growth trend.

Since silver correlates relatively closely with national debt, we can use national debt as a clear, objective, and believable proxy to model the future price of silver. Extend national debt and silver prices forward for the next six years based on the exponential increase from the last five years, and the result is the following table. Bracket silver prices, high and low, based on past annual volatility of roughly +60% and -35%. You can see from the graph that silver prices are very erratic – silver rallies too far and too fast, and then crashes to absurdly low levels. These stunning rallies and crashes have happened for at least 35 years and probably will continue throughout this decade.

Whether or not prices and crashes are manipulated, and there seems to be credible evidence to indicate such, the “big picture” view is that silver has rallied from about $4 to nearly $50, crashed back to about $25, and is set to rally to well over $100 in the next few years. The week to week movements will become even more extreme so focus on the long-term trend to reduce anxiety and fear.

As you can see, this projection for silver prices indicates that silver could reach $100 as soon as late 2015, with a theoretical projected price of $100 about 2017. The price of silver is about $32.00 as of November 1, 2012.

The next graph shows the price of silver, on a logarithmic scale, with high and low trend lines. The horizontal line at $100 shows the earliest and latest dates at which the trend lines project silver will reach that price. Those dates are 2015 through late 2017, which are consistent with the above projection based on the tight correlation to the national debt. The important realization is that $100 silver is just a matter of time – say three to five more years – depending on the level of QE “money printing,” inflationary expectations, dollar devaluations, fiscal insanity, government deficit spending, wars, and welfare. We have been warned!

Conclusion

We may be skeptical of price projections for silver, but projections for national debt are quite believable. Since the correlation is very close, future silver prices can be projected, assuming continuing deficit spending, QE, and other macroeconomic influences. A dollar crash or an unexpected bout of congressional fiscal responsibility could accelerate or delay the date silver trades at $100, but the projection is reasonable and sensible. Silver increased from $4.01 (November 2001) to over $48 (April 2011). A silver price of $48 seemed nearly impossible in 2001, yet it happened. An increase from about $32 (October 2012) to $100 (perhaps in 2015 – 2016) seems much easier to believe, especially after Bernanke’s recent announcement of QE4-Ever. Read We Have Been Warned.

“Inflation is as violent as a mugger, as frightening as an armed robber and as deadly as a hit man.” – Ronald Reagan

GE Christenson
aka Deviant Investor

What Precious Metal Has Performed Best In 2012 And Where Do We Go From Here?

After the recent volatility in precious metals, let’s take a look at the year to date performance of gold, silver, platinum and palladium.  The new year started off with a strong rally across the entire precious metals group which erased some of the losses seen in the second half of 2011.

The across the board rally in precious metals came to an abrupt halt in early March after serial dollar printer Fed Chairman Bernanke made comments suggesting that further quantitative easing was unnecessary (see The Flash Crash In Gold).  Gold, which had closed at $1781 on February 28, sold off sharply, losing $136.75 per ounce by March 14.  Silver, platinum and palladium also sold off and are currently below the highs of the year seen in late February.

The precious metal with the largest gain to date for 2012 is platinum with an impressive 19% gain.  Silver is up 12.72% on the year, followed by palladium with a 5.72% gain and gold is now in last place with a year to date gain of 4.5%.

Platinum may be the most undervalued of all the precious metals based on the fact that the platinum to gold ratio is at levels not seen since 1986  (see Platinum To Gold Ratio Plunges – Buy Signal or New Metric?).

GOLD SILVER PLATINUM PALLADIUM
JAN 3RD $1,590.00 $28.78 $1,406.00 $664.00
MARCH 19TH $1,661.50 $32.44 $1,673.00 $702.00
$ GAIN $71.50 $3.66 $267.00 $38.00
% GAIN 4.50% 12.72% 19.00% 5.72%

Based on previous history, serious precious metal investors probably gave little credence to Bernanke’s suggestion that further Fed monetary easing was not in the cards.  Indeed, barely a week passed before the Fed Chairman was again discussing a new version of quantitative easing known as “sterilized bond-buying.” The always astute James Grant of Grant’s Interest Rate Observer, dismissed the notion that central bank money printing was about to end anytime soon.  In a recent interview with Bloomberg Television, Grant had this to say.

The price of gold is the reciprocal of the world’s faith in the deeds and words of the likes of Ben Bernanke. The world over, central banks are printing money as it has never been printed before. The European Central Bank has increased the size of its balance sheet at the annual rate of 89%. It’s amazing. The Fed is far behind at only 15%. The Bank of England 67% over the past few months. These are rates of increases in the production of paper currencies we have never seen in the modern age. It takes no effort at all. They simply tap the computer screen.

The full interview with Grant is well worth listening to and can be accessed below.

Where do we go from here in what could turn out to be a very interesting year for precious metals?  Here’s a brief roundup of interesting thoughts and analysis from around the web.

The Golden Trader discusses paper trading and manipulation of precious metal prices along with a technical assessment of gold and silver.

Mint State Gold explains why “all the major signs are showing that the quality rare coin market is starting its long awaiting rally. Let me explain why we could see a 30% move higher by year end.”

Why financial repression should be the focus of investor attention.

Gold And Silver Gain On Week – Time Tested Indicator Says Gold Stocks Are Cheap

After last week’s major sell off in precious metals, gold and silver prices gained on the week while platinum and palladium registered small declines.   As measured by the closing London Fix Price, gold gained $19.25 on the week and silver gained $2.00.

As is typical after a major pullback, silver prices were volatile.  Silver’s sharp price increase this year had attracted many day traders and leveraged speculators who were forced to sell as silver prices declined, in large part due to the rapid series of margin increases by the COMEX on silver futures traders.

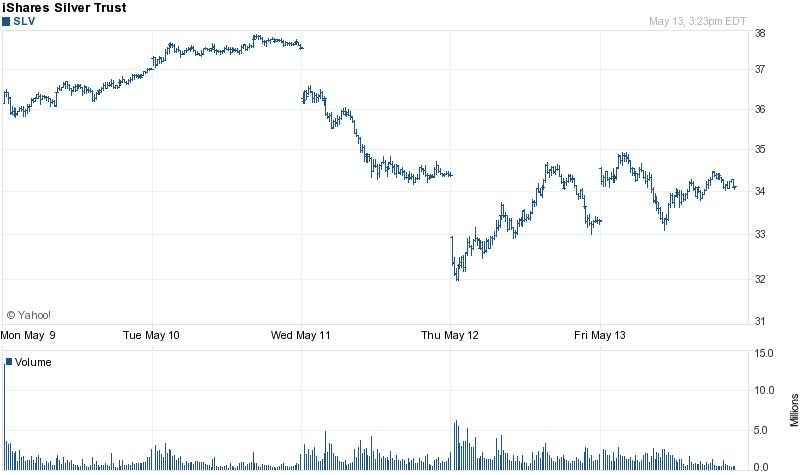
This week’s volatility in silver prices can be seen using the SLV as a silver proxy.  After almost hitting $38 on Tuesday, the SLV plunged to $32 in early Thursday trading before recovering to the $34 level in late Friday trading.

SLV - COURTESY YAHOO FINANCE

The forced liquidation of silver positions by weaker leveraged hands has provided long term investors with a buying opportunity according to the experts at Dillon Gage Metals, a major precious metals dealer.  According to Terry Hanlon, President of Dillon Gage, “This year, silver has had its biggest run in the shortest period of time in recent memory.  Profit-taking corrections are to be expected when markets rally.  This recent price correction doesn’t change the basic fundamentals, which include good demand for silver to make coins in a number of countries.”

Hanlon also noted that the recent strong dollar rally in early May lead to a broad based commodities sell off which extended to precious metals.  The increased margin deposits required by the COMEX which increased from $4,250 a year ago to $16,200 per contract was also an obvious contributor to weakness in silver prices.  Hanlon expects silver prices to remain range bound in the short term saying that “I look for investors and money managers to take a brief breather on the sidelines before getting back into the silver market on the buy side.”

No one can say exactly where silver prices will bottom out before heading higher but Dillon Gage sees “support at the $32 an ounce level”.  Silver’s 200 day moving average is currently in the $28 range which should provide solid technical support.

Precious Metals Prices
PM Fix Since Last Recap
Gold $1,505.75 +19.25 (+1.29%)
Silver $36.20 +2.00(+5.85%)
Platinum $1,774.00 -15.00 (-0.84%)
Palladium $718.00 -3.00 (-0.42%)

It is interesting that amidst a broad based commodities sell off and a major price pullback in silver, gold’s relative performance has been very strong and indicative of fundamental demand.  The recent news that numerous countries are increasing their stockpiles of gold bullion provides further proof that both individual investors and governments are seeking to preserve their wealth by diversifying out of paper currencies.

For investors who prefer to invest in gold mining companies, the K-Ratio, a time tested buy/sell indicator currently has very bullish readings.   The K-Ratio is computed by dividing Barron’s Gold Mining Index by the current Handy and Harmon gold price and reflects the relative value of gold stocks compared to gold bullion.   A reading below 1.2o tells us that gold stocks are cheap compared to gold bullion.  The K-Ratio is currently at .93 indicating that gold stocks are currently a better relative bargain than gold bullion.

Precious Metals Prices Stumble In Wild Trading Week

Commodity and precious metal prices tumbled this week, with gold and silver prices snapping a streak of four consecutive weekly increases. Following the recent run up in prices, there had been some anticipation of a correction. In addition, there were concerns that the Fed’s announcement of the end of QE2 would result in an end to the flood of cheap money which has fueled the rise of commodities.
In the precious metals group, silver was the biggest loser with a drop of almost 30% from last Thursday’s closing London PM Fix Price.  (The London markets were closed on Friday, April 28th.)  The losses in silver far outpaced the declines in other precious metals and many place the blame squarely on the rapid fire multiple margin increases by the COMEX for trading silver futures (See How The COMEX Crashed The Silver Market).

Gold, platinum and palladium also had a tough week with respective price declines of 3.19%, 2.51% and 7.21%.

Precious Metals Prices
PM Fix Since Last Recap
Gold $1,486.50 -49.00 (-3.19%)
Silver $34.20 -14.50(-29.77%)
Platinum $1,789.00 -46.00 (-2.51%)
Palladium $721.00 -56.00 (-7.21%)

Precious metals have had previous serious declines without affecting the long term upward move in prices (see Measuring Declines From The High For Gold and Silver).  Overextended markets will correct but the fundamental forces pushing precious metal prices higher have not changed.  While dollars and other paper currencies can be produced in infinite quantity, the supply of gold, silver and commodities are finite.

Despite the Fed’s promise to stop printing money and its pledge of supporting a “strong dollar”, the dollar has had only a feeble recovery and is close to its all time lows.  The markets clearly have no confidence in Chairman Bernanke’s words and the weak dollar proves it.  Every bull market experiences temporary pullbacks and the precious metals are no exception.  Long term investors should view the latest price consolidation as another potential opportunity to increase positions.

How the COMEX Crashed the Silver Market

By the close of trading on Wednesday, May 4th, the silver market had experienced significant selling pressure that drove prices down by 17.3% from Thursday, April 28th.  This sell off corresponded exactly to a series of increased margin requirements by the COMEX  for trading silver futures contracts.
Silver traders who may have been apprehensive about additional margin increases did not have long to wait.  After the close on Wednesday, May 4th, the COMEX announced two huge additional hikes in silver margin, effective at the close of business on Thursday and another hike effective at the close of trading on Monday, May 9th. As of Monday, initial contract margin requirements would be increased to $21,600 and to $16,000 for hedgers.  A year ago, when silver was trading in the $18 range, the margin requirement for a speculative contract was only $4,250.

The rapid series of five margin increases by the COMEX resulted in raising initial margin requirements for speculators from $11,745 to $21,600 – an increase of 84%.    The margin requirements for hedgers also increased by 84% from $8,700 to $16,000.   Silver futures traders would now be forced to come up with huge amounts of additional cash or liquidate holdings on price weakness.   The collapse in silver prices on Thursday May 5th, triggered by the COMEX margin increases, indicates that many players were forced to liquidate positions.

The actions taken by the COMEX constitute a perfect text book example on how to crash a market. The non stop increases in margin requirements resulted in a dramatic reduction of liquidity in the silver market by forcing out small speculators who were not prepared to commit additional cash for margin maintenance.  As prices fell in response to the COMEX margin increases, bigger players in the silver market were forced to liquidate positions to avoid margin calls and large losses on leveraged positions.

The last two margin increases by the COMEX, after silver had already declined by over 17%, created the perfect crash scenario.   Silver traders liquidating positions to meet new margin requirements caused a further cascade of forced selling and the silver crash became inevitable. The elimination of liquidity from any market will result in falling prices and the COMEX knew this.

If someone wanted to crash the silver market, the moves taken by the COMEX were perfectly designed to accomplish this by reducing liquidity at a time during which the markets were already stressed from previous margin increases. The result was a collapse in silver prices from $48.70 to the $34 range.

In response to the outrage over the devastating series of margin requirement increases, Kim Taylor, President of CME Clearing, which owns the COMEX, issued a statement explaining CME’s actions. According to Ms. Taylor, margin increases are related to risk management and done to prevent default by clearing member firms.  Margins are adjusted based on market volatility and are not designed to move a market or discourage investor participation.  Among the factors considered in setting margins is a CME calculation of a worst case scenario for possible portfolio losses.

Specifically regarding the margin increases on silver futures, Taylor stated that “we have made several changes in recent weeks to adjust to volatility in the marketplace…Our interest is in providing security for the entire market – no matter which way it moves”.

CME’s statement seems disingenuous at best.  The protection they speak of is not for the benefit of investors, but rather for the benefit of CME and clearing house members.  The actions of the COMEX in implementing a rapid series of margin increases, even after silver had already steeply sold off, resulted in large profits to short sellers and reduced risk for CME at the expense of huge losses for silver investors both large and small.

A slower series of margin increases would have seemed more appropriate to address price volatility.  The CME knew or should have known that its actions would severely limit liquidity in the silver market.   The decrease in liquidity caused further market volatility, requiring more margin increases, which in turn crashed the price of silver. Anyone looking into the great silver crash of 2011, can start by looking at the COMEX.

Measuring Declines from the High for Gold and Silver Prices

The prices of gold and silver had each risen to fresh all time highs, just before the severe declines experienced over the past few days.
On April 25, 2011, the price of silver touched an intraday high of $49.82 per ounce. This narrowly eclipsed the previous all time high of $49.45 reached in 1980. Silver’s recent price of $34.64 represents a decline of $15.18 or 30.47%.

After breaking above the $1,450 per ounce level in early April, the price of gold had achieved a string of new all time highs. This culminated with the most recent high of $1,577.40 per ounce reached on May 2, 2011. The recent gold price of $1,473.60 per ounce represents a decline of $103.80 or 6.58%.

The severity of the decline for silver has drastically altered the Gold Silver Ratio. This ratio measures the number of ounces of silver necessary to purchase one ounce of gold. At their respective highs, the ratio would have been 31.65. Recent prices put the ratio at 42.54.

Gold

Recent High: $1,577.40 (May 2, 2011)
Recent Price: $1,473.60 (May 5, 2011)
Decline: -$103.80 (-6.58%)

Silver

Recent High: $49.82 (April 25, 2011)
Recent Price: $34.64 (May 5, 2011)
Decline: -$15.18 (-30.47%)

Gold and silver’s stellar performance over the past several years has been interrupted by other declines, some of them even more drastic. From intermediary peaks reached in March 2008, gold and silver fell sharply as the financial world melted down later that year. Gold fell from $1,011.25 to $712.50 per ounce, losing 29.54%. Silver fell from $20.92 per ounce to $8.88, for a loss of 57.55%.

Despite the recent carnage, both gold and silver hold onto gains for the year to date. From the price levels on December 31, 2010, gold is up $63.35 per ounce or 4.49% and silver is up $4.01 per ounce of 13.09%.

COMEX Increases Silver Margin Requirements for Third Time in Past Week

On Tuesday, May 3rd, the COMEX raised margin requirements for trading silver futures contracts. This was the third increase in the past week.
The new margin requirement per contract was increased from $14,513 to $16,200 for initial margin and from $10,750 to $12,000 for maintenance margin.  Hedgers in silver futures pay maintenance margin as initial margin while traders are required to post the higher initial margin amounts.

Effective last Friday, the COMEX had also increased initial margin from $12,825 to $14,513 and from $9,500 to $10,750 for maintenance deposits.

Two days prior to this, the COMEX had also raised margin requirements. On April 27th, margin for initial contracts were increased from $11,745 to $12,825 and margin for maintenance contracts was increased from $8,700 to $9,500.

The CME Group, which owns the COMEX, has been raising margin requirements in an attempt to reduce volatility and protect itself from potential losses generated by large price moves.  As recently as early February the initial margin requirement per silver contract was only $6,075.

Although margin requirements have been raised significantly, the margin required as a percentage of total contract value has remained within a relatively narrow range of between 6 and 8 percent.   The increase in COMEX margin requirements have merely tracked the increase in the price of silver.

Under current margin requirements, a price decline of 8% could wipe out the margin of a silver trader leaving the COMEX exposed to potential losses if the trader does not come up with additional cash.  As silver prices have climbed almost nonstop, the COMEX has raised margin requirements ten times over the past year in order to maintain the same percentage of margin to the silver value represented by one contract.

Even with the higher margin requirements, silver futures contracts allow a trader to make a highly leveraged investment.  One silver futures contract is for 5,000 ounces worth $218,050 at yesterday’s closing London Fix Price.  The new higher margin requirement of $16,200 represents only 7.43% of the value of  one silver futures contract.

After trading close to the $50 per ounce level late last week, silver closed Tuesday at $41.72 in New York trading for a loss of over $8 or 16% over the past two days.

Precious Metals Soar – Thank You Ben Bernanke

As predicted on Monday, the Federal Reserve policy meeting and subsequent press conference by Fed Chief Ben Bernanke had the potential to cause an explosive move up in the precious metal markets. (see Federal Reserve May Cause Stampede Into Gold and Silver This Week)

At the conclusion of the Bernanke press conference it became clear that the Fed would maintain its policies of cheap credit and debasement of the dollar.  Subsequent economic reports showed a slowing economy, rising food and energy prices and a slowdown in consumer spending.  This was all the markets needed to hear and precious metal prices exploded upwards on the week.

Silver reached an all time high of $49.75 on Monday before pulling back on Tuesday to $44.60 and then resuming its upward streak after the Bernanke press conference.  The closing London PM Fix Price for silver settled at $48.70 on Thursday.  The London markets were closed on Friday, but in New York spot trading silver ended the week at $48.00, up from last week’s close at  $46.26.

Precious Metals Prices
Thurs PM Fix Since Last Recap
Gold $1,535.50 +31.50 (+2.09%)
Silver $48.70 +2.44(+5.27%)
Platinum $1,835.00 +23.00 (+1.27%)
Palladium $777.00 +12.00 (+1.57%)

As measured by the London PM Fix Price, gold closed Thursday at $1,535.50.  London markets were closed on Friday, but in New York trading, gold ended the day at $1,566.70, soaring $29.90.   From last week’s London Fix Price close of $1,504.00, gold exploded upwards for a gain of $62.70.

As precious metal investors racked up huge gains on the week, many were probably thinking of sending a thank you note to Ben Bernanke.  The reality is different.  Most investors, no matter how bullish they may be on precious metals, are probably diversified and do not have a 100% portfolio allocation to gold and silver.

Investor gains on precious metals, while helping to preserve wealth, may have only partially offset the wealth destruction caused by zero interest rates and falling home prices.  The majority of Americans have the bulk of their wealth tied up in their personal residence and bank accounts and  have seen major declines in their home equity and close to a zero return on savings.  Fed policies are driving more and more investors into the precious metals markets and soaring prices are proof of that.

As noted the London markets were closed on Friday, April 29.  Precious metals prices soared on Friday in New York trading with gold ending at $1,566.70, silver at $48.00, platinum at $1878.00 and palladium at $777.00.