April 20, 2024

Gold and Silver Soar As Fed Rejects Tapering and Revs Up The Printing Presses

Physical-GoldThe months long guessing game on whether or not the Fed would start tapering its $85 billion per month of treasuries and mortgage securities came to a conclusion today as the Fed promised to keep the printing presses going full blast.

Many analysts had come to the conclusion that the economy had strengthened enough for the Fed to begin reducing monetary stimulus but they were wrong as Fed, in Surprise Move, Leaves Bond-Buying Intact.

The Federal Reserve postponed any retreat from its long-running stimulus campaign Wednesday, saying that it would continue to buy $85 billion a month in bonds to encourage job creation and economic growth.

As Congressional Republicans and the White House hurtle toward another showdown over federal spending, the Fed said it was concerned that fiscal policy once again “is restraining economic growth,” threatening to undermine what the Fed had described just months ago as a recovery gaining strength.

Proponents of aggressive asset purchases, including Mr. Bernanke, also face mounting pressure from internal critics who argue that the modest benefits of bond-buying are increasingly outweighed by the risk that the Fed is encouraging excessive speculation or interfering with normal market function.

Some critics inside and outside the Fed have even begun to argue that the central bank’s bond-buying is preventing a return to normalcy.

“The economy is positioned to benefit from modestly higher longer-term interest rates,” Ms. George said earlier this month. She noted that higher rates could increase the income of retirees and bolster bank profits without a commensurate increase in risk-taking.

Despite the growing criticism of his securities purchase program the Fed decided that the time was not yet right for reducing the one trillion dollar securities purchase program which is financed by the Fed’s money presses.  According to the FRB press release:

Taking into account the extent of federal fiscal retrenchment, the Committee sees the improvement in economic activity and labor market conditions since it began its asset purchase program a year ago as consistent with growing underlying strength in the broader economy. However, the Committee decided to await more evidence that progress will be sustained before adjusting the pace of its purchases. Accordingly, the Committee decided to continue purchasing additional agency mortgage-backed securities at a pace of $40 billion per month and longer-term Treasury securities at a pace of $45 billion per month.

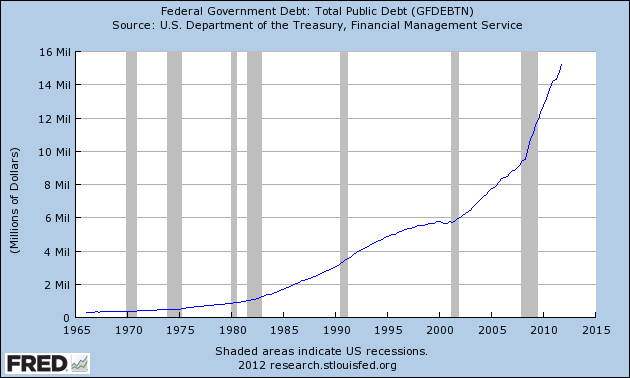
The Fed has already blown up its balance sheet to $4 trillion and the federal government has almost tripled its debt load to $17 trillion from $6 trillion in 2002.  After this massive stimulus of $15 trillion into the economy, the Fed now tells us that more is needed.

US Debt

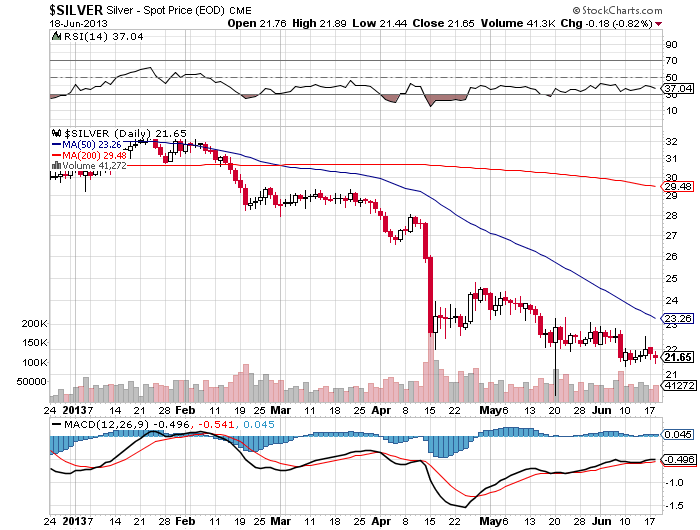
Today’s actions tell us that the Fed will never find an opportune time to reduce its money creation and the gold  and silver markets reacted accordingly.  After the Fed’s announcement gold skyrocketed by over $50 per ounce and silver shot up by almost $1.50 per ounce.

The reasons for holding gold and silver have never been stronger despite the recent pullback in prices and today’s announcement by the Fed serves to further prove this assertion.

gold soars

silver soars

Higher Gold and Silver Prices Are Guaranteed By the Endless Creation of Paper Currency

bernanke's paperBy: GE Christenson

Step into the “Wayback Machine” and journey back in time to:

1932: Silver was selling for about $0.25 per ounce (average annual price per Kitco.com). Our $100 bill would buy about 400 ounces.
1962: Silver was selling for about $1.20 per ounce. Our $100 bill would buy about 83 ounces.
1982: Silver was selling at about $10.60 per ounce. Our $100 bill would buy about 9 ounces. (Early in 1980 silver spiked to about $50 per ounce for a day or so and then crashed.)
2012: Silver was selling for about $31 per ounce. Our $100 bill would buy about 3 ounces.
Today: Silver prices have been volatile. Our $100 bill will buy perhaps 4 ounces of silver.

Over the course of the last 100 years, during which we have been blessed with the Federal Reserve and massive government spending, our $100 bill no longer buys 400 ounces of real physical silver; now it will purchase only about 4 ounces.

What have we learned from our quick survey of the history of silver prices?

Prices are volatile – they can go drastically higher and then crash.

On average, $100 buys less silver with each passing decade because the currency is worth less each decade.

What can we expect for the price of silver? It seems obvious that:

All paper currencies eventually decline in value to their intrinsic value – approximately zero. Voltaire understood this concept almost three centuries ago. Several hundred unbacked paper currencies have become worthless since the time of Voltaire.

Governments and banks represent the status quo so very little will change without a crisis or collapse. Governments spend more than their revenues and borrow the difference, thereby increasing total debt and the money supply. The status quo involves the creation of more and more currency, all of which is backed by debt, not assets.

US Government Revenue, Expenses, Official Debt (rounded in $Billions):

Year                       1971    2012
Expenses                210     3,500
Revenues               187     2,400
Official Debt           408    16,100

Inflation and debt are “hardwired” into our monetary system. Don’t expect government spending or total debt to decrease unless there is a massive financial crisis.

Official debt is shown but it does not include unfunded liabilities for Social Security, Medicare, Pensions and so forth. The total debt including unfunded liabilities has been calculated in the $100 – $200 Trillion range and rapidly rising.

As the money supply and total debt increase, average prices increase. Hence silver has increased from a few cents to many dollars per ounce. Five cent coffee and $0.19 gasoline are ancient history.

The process will continue until it no longer can – perhaps a few years, perhaps a decade. Don’t bet on the imminent demise of a system that enriches banks and the political elite while it increases governmental power.

Plan on reduced purchasing power of unbacked fiat currencies.

Bet on the inevitability of higher silver and gold prices – because the value of the paper currencies is decreasing every year.

For the Future


Eighty years ago $100 purchased 400 ounces of silver while today that $100 purchases about 4 ounces. Someday soon $100 will purchase only one ounce of silver.

Depending on how rapidly the money supply is increased and how quickly confidence in paper money evaporates we may see the day when it takes ten, or more, $100 bills to purchase a single ounce of silver. Hyperinflation has happened in many countries in the past 100 years and many good analysts believe that it COULD occur again in Europe and the United States. If hyperinflation occurs, your silver and gold will be worth much more in nominal dollars and will, to some extent, protect your purchasing power. Unfortunately, life in a hyperinflationary economy is likely to be exceedingly difficult for most people.

Prepare by purchasing physical silver and gold and storing it outside the banking system.

Read: Gold, Silver and Sins of the Past

By GE Christenson, aka Deviant Investor

GE Christenson

Gold To Silver Ratio Says Silver Is A Screaming Buy

washington-quarterBy: GE Christenson

Six of eight significant silver market lows in the past 23 years occurred when the GSR (gold to silver ratio) was > 64 and the RSI (Relative Strength Index of the GSR was < 35.

Silver, in late June and early July 2013, met the above criteria, along with a near record low RSI of the GSR, and a record low in the TDI Trade Signal Line. These are strongly bullish conditions.

Previously, two other important lows occurred about 4.7 years ago, and 9.2 years ago. Both of those lows were followed by explosive rises that took silver prices much higher. The June/July 2013 low looks similar to the 2004 and 2008 lows. We will see if the upcoming rally is similarly explosive or not.

October 2008: $8.53 to nearly $50.00

May 2004: $5.50 to about $21.00

The Analysis:

Much has been made of the gold to silver ratio. It is currently (August 8, 2013) about 64, with gold about $1312 and silver about $20.41. After examining the data for the GSR for the past 23 years, we find that:

• The highest ratio was about 102 in February of 1991. (silver very low) • The lowest ratio was about 32 in April of 2011. (silver quite high) • The average ratio (weekly closes) since 1/1/1990 has been about 65. • The average ratio for the past 10 years has been lower at about 58.

All significant price lows in the past 23 years occurred at (GSR) ratios greater than 64. However, a better indicator of significant lows is the Relative Strength Index of the GSR based on 21 weekly closes combined with the GSR.

Not all significant lows were marked by HIGH ratios and a LOW RSI of the ratio. But, a high ratio along with a low RSI were strongly indicative that a significant price low had just passed (typical) or was due very soon. The low in the RSI usually occurs about two weeks after the actual price low. Think of this as confirmation of the price low.

Gold/Silver Ratio Courtesy kitco.com

Gold/Silver Ratio
Courtesy kitco.com

Further:

July 05, 2013 had a silver low of $18.73 (weekly close – actual low was in June). Silver had fallen 46% in 9 months since a temporary high of $34.57 in October of 2012.

about 4.7 year earlier:

October of 2008 marked a silver low of $9.29 (weekly close – actual low was $8.53). Silver had fallen 55% in 7 months since a high of $20.94 in March of 2008.

about 4.5 year earlier:

May of 2004 marked a silver low of $5.60 (weekly close – actual low of $5.50). Silver had fallen 33% in 1.5 months since a high of $8.31 in April of 2004. The rapid price collapse (only 1.5 months) did not allow the RSI of the ratio to reach a low value. The TDI Trade Signal Line Indicator (an overbought / oversold oscillator) made its lowest (most oversold) reading in July 2013 in the past 39 years – the entire range of my data. Many other oscillators were also deeply oversold and similarly bullish.

The near future for silver prices is uncertain, especially with the increasing use of High Frequency Trading (HFT) and the post 2008 “managed” markets. Perhaps the good people at JP Morgan or Goldman Sachs have another crash planned, which we will find out in due time. But indications are that the big players (JP Morgan etc.) are more long and less short in the paper gold market than in many years, or perhaps ever. Hence they are nicely positioned to profit from a large rise in the price of gold.

Silver seems likely to rally, shoot ahead of gold with a larger percentage increase, and thereby decrease the ratio below 40.

CONCLUSIONS:

Six of eight significant silver market lows in the past 23 years occurred when the GSR (gold to silver ratio) was > 64 and the RSI (Relative Strength Index) of the GSR was < 35.

Silver, in late June and early July 2013, met the above criteria, along with a near record low RSI of the GSR, and a record low in the TDI Trade Signal Line. These are strongly bullish conditions.

Previously, two other important lows occurred about 4.7 years ago, and 9.2 years ago. Both of those lows were followed by explosive rises that took silver prices much higher. The June/July 2013 low looks similar to the 2004 and 2008 lows. We will see if the upcoming rally is similarly explosive or not.

October 2008: $8.53 to nearly $50.00
May 2004: $5.50 to about $21.00

Read: Back to Basics – Gold, Silver and the Economy

GE Christenson
The Deviant Investor

The Price Has Crashed; it’s Time To Buy Silver

silver-eaglesA Fun Look at Silver’s Looong Correction and a Positive Look Ahead

By:  Joe (Silverheels) Paulson

I remember it like it was yesterday…

It was the spring of 2011.  It was exceptionally warm and glorious. All was right with the world.   The air was sweeter, the sky bluer, the birds and bees were birdier and buzzier… it was all beautiful, man!  Why? Because those were the weeks that found me becoming wealthier by the day.  All of that bulky, heavy silver that I had purchased over the previous 10 years was turning me into an investing genius.  There was a different look in my wife’s eye.  What was it?…  Joy?  No… Love?  Yeah, sure, of course, but there was something else… it was more like… respect.  I was no longer the crazy man who hoarded silver metal.  I was now that wise investor who was making our family rich… well, rich-er, at least.

 As those weeks passed, and I did my mental calculations several times a day in front of the computer, or CNBC, or anywhere else I could get my quote, I realized that price was going vertical and that it would be wise to sell a portion of my stack because I, and everyone else in the world, knew that the correction was coming. (pause for reflection and dramatic effect here)  I won’t go into how or why I didn’t sell some of our precious, and I won’t say it’s been the most pleasant two years of silver holding.  I will say, though, that the look in my wife’s eye is long gone.  In case you haven’t been following the silver news, price has experienced a bit of a setback.  “How much of a setback?” you ask.  Well, (mumbling) it went from almost $50 to $18 or so.  “What’s that you say?  You’re mumbling.  Speak up, please.”  I say it crashed from $50 to $18.  (pause here)  When you are finished laughing and wiping your eyes I tell you that now is the time to buy.  (yet another pause) When you get up from the floor from your ROTFLMAO’ing and you catch your breath you ask me how I can say that.  Why is now the time to buy?  I reply it’s because the price crashed from $50 to $18.

Maybe you’ve heard this one before, but there’s an old saying that goes “Buy low; sell high.”  Well, my friends, relatively speaking, the price is low.  Doesn’t that mean it’s time to buy? Well, the thing about that saying is that it’s not very clear how high is “high” or how low is “low.”  Could the price go lower?  Sure it could; in fact, it might.  But if it does, it probably won’t go much lower.  And even if it does, it’s gonna’ go up, and up, and up.  How do I know?  Well, I am not a financial advisor.  I am not a silver salesman.  I am merely looking around at this world of ours; at the shaky governments and economies; at the bail outs and imminent bail ins; at the real inflation around us (not the inflation rate that the government offers us); at the incessant printing of dollars and euros and most all currencies world-wide, and I know that we cannot continue like this.  There are some rough times a’comin’ and when there is instability, people seek stability.  In financial-speak, that means precious metals – silver and gold.

If my “gut instinct” isn’t enough for you.  Check out just about any article written about the fundamentals of silver written over the last 10 years.  Review some of the excellent articles written on the Gold and Silver Blog.  When you look at them, ask yourself what has changed?  I’ll tell you the one thing that has changed:  The price of silver has gone down.  That means that it’s even more of a screaming buy than it was back in 2011.  If that’s not enough (and it probably shouldn’t be), here’s some more for you (in case you’ve forgotten):

  • The demand for silver is high and growing every day; at the same time silver stockpiles are being depleted and there is much talk about an imminent financial and industrial silver shortage
  • Silver is a very small market; when a few “big players” get involved, price will move rapidly upwards
  • Silver typically follows gold;  and the fundamentals for gold are outstanding right now
  • Many countries around the world, including China and India, are importing large quantities of silver and gold
  • The silver/gold ratio is abnormally high (~60:1); it’s more traditional level is more like 15:1.  That means that silver is probably a much better investment compared to gold right now.  (But they’re both going to go up!)
  • Many silver analysts are claiming that the bottom is in for this correction.  Many claim that the next stop is in the $60 range; after that comes the $100 range.  Some even claim that if our government keeps printing $85 billion every month, we may even see four-figure silver.

And If that’s not enough for you to go out right now and buy some silver, then I encourage you to stop for a moment, check the news, and do some more research; breathe for a minute and listen to your gut.  The signs are all around us that challenging times lie ahead.  Even if you’re not convinced, purchasing at least a little bit of silver or gold – maybe 5%-10% of your savings – would probably be a good idea.  Personally, I’m looking forward to seeing that look in my wife’s eye once again… soon.

Joe (Silverheels) Paulson is a husband, father, teacher, and an avid silver follower and investor (for over 30 years – !)  You can click here to find out more about different types of silver investing.  Get more of his unique and fun perspective on silver investing at tobuyandsellsilver.com.

Gold and Silver Are the Only Safe Assets In a Dangerously Unstable Financial System

Physical-GoldBy: GE Christenson

Consider these thoughts on “the great lie,” our strange world, its unstable financial system, overwhelming debt, exponential growth, inevitable collapse, fractional reserve banking, counterparty risk, and gold – from highly intelligent individuals who think beyond the traditional:

From Karl Denninger: Detroit: The Shape Of Things To Come

“If you make political promises that can only be met through increased tax rates, now or in the future, you begin the process of slitting your own throat. That outcome is inevitable when you agree to political promises that have escalating expenses over time as pensions, medical benefits, salary “step” increases, bond issues that have a payment schedule longer than the useful life of the asset bought and similar.

There is no way out of this box other than to repudiate those promises.”

From Richard Russell: (subscription service)

“The compounding debt is the monster that is eating the U.S. The only way out is to renege on the debt or try to pay it off with inflation or hyperinflation. The bull market in bonds is over. From now on, we are dealing with a bear market in bonds, at which time natural forces will drive bonds down, and as bonds fall, interest rates will rise.”

“It’s taken almost two centuries for bankers to pull the wool over Americans’ eyes, but today you and I are working for intrinsically worthless paper that can be created by bureaucrats – created without sweat, without creative ability, without work, without anything but a decision by the Federal Reserve.

This is the disease at the base of today’s monetary system. And like a cancer, it will spread until the system ultimately falls apart. This is the tragedy of the great lie. The great lie is that fiat paper represents a store of value, money of lasting wealth.”

From Bill Bonner: Why Gold is the Only Money that Works

“When you have a system based on credit, rather than bullion, deals are never completely done. Instead, everything depends on the good faith and good judgment of counterparties – including everybody’s No. 1 counterparty: the US government. Its bills, notes and bonds are the foundation of the money system. But they are nothing more than promises – debt instruments issued by the world’s biggest debtor.

A credit system cannot last in the modern world. Because, as the volume of credit rises, the creditworthiness of the issuers declines. The more they owe, the less able they are to pay.”

“Naturally, everybody loves a credit system… until the credits go bad. Then they wish they had a little more of the other kind of money. Wise governments, if there are any, take no chances. They may feed the paper money to the people. But they hold onto gold for themselves. Throughout history, the most powerful governments were those with the most gold.”

But suppose much of the government and central bank gold is gone. As Eric Sprott concluded, after considerable research,

“Our analysis of the physical gold market shows that central banks have most likely been a massive unreported supplier of physical gold, and strongly implies that their gold reserves are negligible today.”

It seems likely that the western governments and central banks have sold (or leased to a bullion bank who sold it to a buyer in China, India, Hong Kong, or the middle-east) most of their gold. Germany recently requested the return of their gold from the Federal Reserve Bank in New York but was told they would have to wait seven years to get a portion (only 300 tons) of it. It is clear there is more to the story – and the obvious conclusion is that the Federal Reserve Bank can’t easily return what it no longer possesses. In non-banking circles, this could be called theft or embezzlement, but in the banking world it is called “leasing” or rehypothecation, and it is legal.

Bill Bonner:

“But if they (central banks) have sold such massive quantities over the last 10 years, how much do they have left? Maybe not much.

Which wouldn’t be surprising. Western central banks are committed to their credit-money system. They intend to stick with it. And they know that unraveling this unruly skein of credit would be extremely painful.

Selling gold into the bull market of the last 12 years probably seemed like a very smart move. We’ll see how smart it was later, when the credit-based money system blows up.”

But, I ask you, who formerly owned the gold, and who is quietly amassing a vast horde of gold to increase global influence in the future? This process of selling gold and converting it to paper promises has been occurring (so the evidence indicates) for several decades and appears to be working well for now. The “game” appears to be:

Asian countries and the middle-east accumulate more gold and unload their dollars.

The bullion banks borrow gold from the central banks, sell the gold, and earn interest.

The central banks claim they own the gold, even though much of it is almost certainly gone.

The gold sales support the value of the dollar so the US government benefits.

Consumers in the US pay for imports with dollars that are still relatively strong, although when the dollar weakens and gasoline costs $10, the “game” won’t look so attractive.

Conclusions

Politicians and bankers work together to benefit themselves at the expense of the people actually producing something of value. Politicians increase their power and influence by spending ever-increasing amounts of paper currencies. The bankers enable the process by creating the paper currencies (from nothing), loaning those newly created dollars, euros, yen, and pounds to the politicians, governments, and businesses, and collecting interest. This process succeeds until the debts must be paid. Then:

Borrow more paper currencies, extend and pretend, lie and deny, etc.

Inflate or die! QE4-ever!

Raise taxes and fees. (Hope the parasites don’t kill the host.)

Encourage the Fed to create enough new currency to bail out the bankers and prevent a deflationary collapse (the other option besides horrific inflation).

Let consumer price inflation accelerate. $10.00 gasoline anyone?

When the mathematics doesn’t work, when the plan is lame, when the debts must be paid, when the sins of the past must be acknowledged and corrected, there are few choices remaining.

Review the cogent thoughts from The Burning Platform, Karl Denninger, Richard Russell, and Bill Bonner. Then ask yourself:

Do you believe debt and interest payments can increase forever?

Do you believe that either an inflationary or deflationary collapse (in some form) is inevitable?

Do you believe that unbacked paper currencies represent a store of value or a wasting asset? (Do you remember gasoline at $0.19 per gallon?)

Do you trust the lasting value of gold more than the integrity of a politician’s promise?

Do you believe that the US government and the Federal Reserve have all the gold they claim (not audited since the 1950s), when it benefits both the US government and the Fed to surreptitiously “lease” gold (sell it into the market)?

Do you believe that Russia, China, the Arab countries, Hong Kong, India, and many other countries are making a wise choice by trading dollars for gold?

Do you believe that your food and energy expenses will remain constant or substantially increase in the next four years?

Do you believe congress will balance the budget and that world peace is coming?

Do you believe and understand counterparty risk?

Do you believe the existing economic system will meet your needs in the future?

Having considered your beliefs, do you think it would be wise to convert some of your paper assets to real gold and silver? If so, I encourage you to purchase gold and silver from a reputable dealer and store them safely outside the banking system.

GE Christenson
aka Deviant Investor

The Price Correlation Between Silver and Crude Oil

1881-CC-Morgan-DollarBy: GE Christenson

Crude Oil bottomed (weekly data) about 12/25/1998 at $10.75. It rose erratically for several years, hit another low on 8/24/2007 at $68.70, and then rallied dramatically to an all-time high of $147.20 on 7/11/2008. Subsequently, crude collapsed to $35.35 on 12/26/2008.
High to Low Ratio: 147.20 / 10.75 = 13.69
Total time: 12/25/98 to 7/11/08 = 9.55 years
Final blow-off Ratio: 147.20 / 68.70 = 2.14
Time for Blow-off: 8/24/07 to 7/11/08 = 0.88 years
Collapse Ratio: 35.35 / 147.20 = 0.24
Collapse time: 7/11/2008 to 12/26/2008 = 0.46 years

Silver bottomed (weekly data) about 11/23/2001 at $4.01. It rose erratically for several years, hit another low on 2/5/10 at $14.78, and then rallied dramatically to a nearly all-time high of $48.58 on 4/29/2011. Subsequently, silver collapsed to $18.53 on 6/28/2013.
High to Low Ratio: 48.58 / 4.01 = 12.11
Total time: 11/23/01 to 4/29/11 = 9.44 years
Final blow-off Ratio: 48.58 / 14.78 = 3.29
Time for Blow-off: 2/05/10 to 4/29/11 = 1.23 years
Collapse Ratio: 18.53 / 48.58 = 0.38
Collapse time: 4/29/11 to 6/28/13 = 2.17 years

So What?

Both crude and silver took about 9.5 years to rally from a significant low to an important high. The high to low ratios were similar – over 13 and over 12. Both collapsed after their blow-off highs and fell 76% and 62% from their highs. Crude rallied during the next four years and is now over triple its crash low. Silver, a much smaller and more volatile market, seems likely to do something even more dramatic.

Questions

Assume market prices for crude oil are based on supply and demand of physical crude oil. Do you think supply and demand for physical crude oil changed sufficiently between the crude low in August of 2007 to the high in July 2008 to the low in December 2008 to justify a rise from $68.70 to $147.20 and then a fall to $35.35?

Answer one: Obviously it did; the market price changed and the market price is always correct.

Answer two: Perhaps politics, High Frequency Trading (HFT), and derivatives also affected the supply and demand of paper contracts for crude such that the price of crude more than doubled and then collapsed by 76% in about 1.3 years.

You choose the best answer.

Assume market prices for silver are based on supply and demand. Do you think supply and demand for physical silver metal changed sufficiently between the silver low in February 2010 to the high in August 2011 to the low in June 2013 to justify a rise from $14.78 to $48.55 and then a fall to $18.53?

Answer one: Obviously it did; the market price changed and the market price is always correct.

Answer two: Perhaps politics, High Frequency Trading, and derivatives also affected the supply and demand of paper contracts for silver such that the price of silver more than tripled and then collapsed by 62% in about 3.4 years.

You choose the best answer.

Why Discuss This Parallel?

Sentiment for silver and gold was (June 2013) exceptionally low – at multi-year or multi-decade lows depending on who is measuring sentiment. As of the end of June 2013 there seemed to be “no light at the end of the tunnel” for silver bulls and there was no joy in “silver-ville.” Most people I know wanted nothing to do with silver or gold.

It was about the same with the crash low in crude 4.5 years ago in December of 2008 and the S&P500 crash low in early 2009. But the world economies demanded crude oil while the supply was flat or declining. Consequently the price rallied back to over $105 this month – about triple its collapse low price.

I think it is quite reasonable to expect that silver will also rally substantially from here. In fact an explosive rally would not be surprising. What seems likely is a multi-year rally (that culminates in another price blow-off) to four or six (or ten) times the low price in June, the inevitable price collapse, and then some months or years in a trading range at prices that make sub-$20 silver look like an absolute bargain. I suppose that if the US congress balances the budget AND world peace is confirmed, then silver prices are unlikely to rally… but I would rather bet on higher silver prices.

How are crude oil and silver similar?

Both had a nine plus year rally to a blow-off peak, collapsed, and rose again. Crude began its rally about three years before silver, and peaked about three years earlier. Both are essential for modern economies and their prices on the paper exchanges are heavily influenced by politics, HFT, and derivatives. The supply of crude is probably declining and the supply of silver is growing quite slowly. The world-wide demand for crude is likely to increase, even with slowly growing economies. The world-wide demand for silver is likely (my opinion) to dramatically increase due to increasing industrial demand and potentially explosive investor demand. There is good reason and good historical precedent to expect the price for both commodities to increase substantially, with great volatility.

Do you remember when crude was priced under $5.00 per barrel and silver was priced under $2.00? Given the penchant for governments around the world to run huge deficits, amass unpayable debt, and increase the money supply (monetize bonds) in seemingly unlimited quantities, do you think either $250 crude or $100 silver is unlikely in the next several years?

Neither do I!

We will see $250 crude, $10 gasoline, and $100 silver, unless the world’s economies and governments become responsible and accountable.

Have you purchased your Silver Eagles today?

Read: Silver – Keep It Simple
Read: Gains In Silver Will Be Historic

GE Christenson
aka Deviant Investor

Silver Market Incredibly Oversold – Technicals Flashing Buy Signal

silverBy: GE Christenson

For the umpteenth time (actually the 3rd since June 2012), silver has given a buy signal according to my reading of the technical indicators.

Problem: How valuable is technical analysis (moving averages, oscillators, over-sold conditions, etc.) when the silver and gold markets are dominated by computers (High Frequency Trading – HFT) and not human beings?

GATA had this to say: “Technical analysis of a manipulated market like gold has been tedious nonsense for years, but these days, with virtually infinite paper dropped on the gold futures market at illiquid times to drive the price down even as the physical market remains strong, technical analysis has become insulting.

The only analysis worth anything anymore is the identification of the source of all the paper.

The suspects are obvious — Western central banks.”

Gold and silver bottomed in June of 2012, dollar printing moved into high-gear, and the metals “should” have rallied from there. Instead, they did a brief rally and fell to extraordinary lows in April 2013 and even lower lows in June of 2013.

How Extraordinary?

Technical indicators are still somewhat valid (in my opinion) at indicating how much a market is over-bought or over-sold, even if those indicators are less useful (thanks to HFT) at indicating future moves and timing.

Silver RSI (Relative Strength Indicator – 14 period): On a weekly basis, it is the lowest in 40 years of data and nearly that low on a daily basis. This timing indicator suggests that silver is extremely over-sold on both a daily and weekly basis. Gold is similarly oversold.

Gold stocks % bullish Index ($DPGBM): This indicates the % of gold stocks above their 200 day moving average. It currently ranks at zero – gold stocks have been hammered. This indicates gold stocks are very low and hopefully ready to rally. Sentiment toward gold among independent financial advisors, as reported by The Hulbert Financial Digest, is at all-time lows. Prices usually rebound after such lows in sentiment.

COT Net long: The Commitment of Traders data provided by the CFTC indicates the long and short positions of the non-commercials and commercials. Yes, I know, the data is somewhat suspect, but it still has value. Take the net of non-commercial longs less shorts and the net of commercial longs less shorts. Then subtract the net commercial longs from the net non-commercial longs. This difference correlates quite well over a long period of time with the price of silver. When the net long difference (as described above) is low, silver is low and due to rally. As of Friday, June 28, 2013 that net long difference was the LOWEST since the beginning of my data in January 2001 and probably for several decades. This indicates that the large bullion banks (JPM, etc.) are in a position to profit from a rally in the silver (and gold) markets.

The weekly TDI – Trade Signal Line (a technical oscillator) for silver as of June 28, 2013 registered the lowest reading since my data began in 1974. On a daily basis, the April reading was the lowest since 1980, and the June low was only slightly higher. Silver is ready to rally.
My risk/reward index is a weighted blend of COT data, moving averages, relative strength timing oscillators, and disparity between the current price and a long-term moving average. This weekly index has been quite accurate at indicating bottoms in the silver market. What it cannot do is indicate if a lower low is coming in another few months or if the current low is likely to indicate a multi-year bottom. This indicator is currently the most oversold since the beginning of my data in January 2001 and is even more oversold than at the bottom after the 2008 crash in the silver market. The indicator is currently suggesting a major rally is ahead for the silver market – perhaps a multi-year continuation of the bull market. Please examine the graph of silver prices and this risk/reward index.
silver-risk-reward-june

There are many other technical indicators, oscillators, and sentiment measures that suggest a similar story. For all practical purposes, it appears that the large bullion banks and traders (the JPMs, etc.) are now net long in gold and probably net long in silver. The stage is set for a JPM managed rally to take advantage of their net long position, having dumped their shorts in the last two engineered declines in gold and silver.

However, it is possible that their agenda is to generate further support for the dollar and additional declines in gold and silver. With essentially unlimited financial backing, their ability to create and sell huge quantities of PAPER silver and gold and a “free pass” from the regulators, they are the elephants in the room, and they can overwhelm technical indicators, oversold conditions, and sentiment if they so choose. That would not be the case if we had an honest physical market where a company has to have physical product to sell it.

Conclusio

  • The stage is set for the large bullion banks to profit from a rally. Expect a rally.
  • The silver and gold markets are deeply oversold and sentiment in both markets is very low. Are silver and gold investors currently disgusted and disappointed or happy and excited? Right! Rallies occur when practically everyone is disappointed, disgusted, or frightened out of the market. It was the same with the S&P (March 2009, October 1987) and crude oil (December 2008) and gold (October 2008).
  • Now is a time to buy gold and silver, not sell them.
  • Listen to the national media and consider doing the opposite.
  • Silver and gold sentiment and indicators are at multi-year, multi-decade, or all-time lows. The indicators and sentiment suggest the high probability of a substantial rally ahead.
  • The cash markets are strong. Individuals and central banks are buying gold and silver in Russia, China, India, and other Asian countries. Individuals who see the big picture are also buying in Europe and the US.

Does a certificate of deposit paying 1%, gold, or silver look more safe and rewarding at this point in time?

Read:
Silver Cycles: What Next?
Back to Basics – Gold, Silver, and the Economy

GE Christenson
aka Deviant Investor

Has The Price of Silver Already Discounted Weak Investment and Industrial Demand?

american-silver-eagle
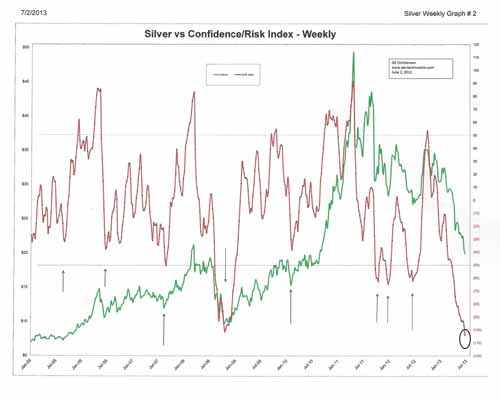
Precious metals analyst Suki Coper at Barclays takes a look at the silver market in an interview with Bloomberg Television.

Silver investors have endured a brutal year as the price of silver declined by $12.20 or 39.5% since  the beginning of the year.   Will the price of silver quickly recover as it did after the 2008 collapse or have the fundamentals changed so significantly that a price recovery may be years away?

Suki Coper notes that silver is struggling to find support from both industrial and investment demand which has turned “quite weak.”  Markets are a discounting mechanism and weak demand seems to already be reflected in the price of silver.  The next price move in silver may hinge on whether or not silver demand recovers from this point or continues to decline.

Ms. Coper notes that imports of silver by China, which had been an area of price support, are at the lowest level since January 2006.  The recent slowdown in economic growth in China along with a looming banking crisis does not bode well for a pickup of industrial demand for silver.

The influence of the Federal Reserve on silver could also be negative if the Fed gets more hawkish in its monetary policies.

Barclays Sees Gold At $1,500 By Year End

gold buffaloIs there any hope for a recovery in gold and silver prices by year end?
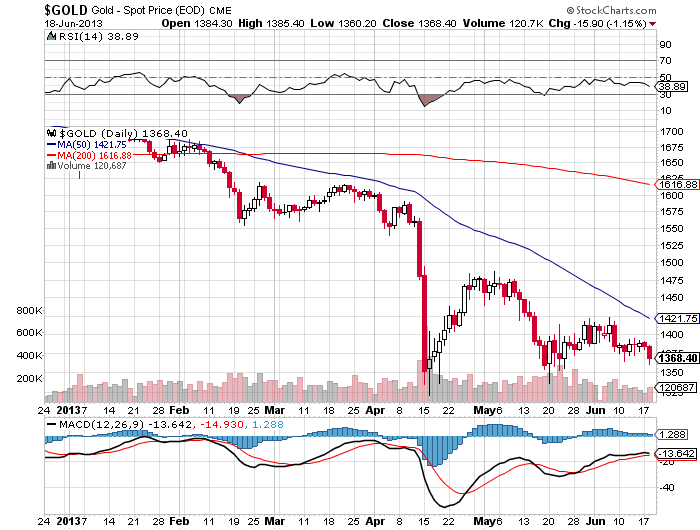
Precious metals analyst Suki Coper discuses the prospects for the gold and silver markets in an interview with Bloomberg Television.

Ms. Coper notes that silver tends to follow the gold market but should show more price weakness relative to gold.  In order for the price of silver to stabilize, the precious metal needs investment support from both the industrial and investment side.   Economic weakness in both China and Europe currently portend weak industrial demand for silver.

Despite the current weakness in both gold and silver, Ms. Coper sees the price of gold approaching $1,500 by the end of the year.

Since the beginning of the year, the price of gold has dropped by $303 per ounce or 18%, to a closing price of $1,378.50 at the close of Tuesday’s trading in London.

courtesy: kitco.com

courtesy: kitco.com

Silver’s price decline has been even steeper than gold with a drop of $9.07 per ounce or 29.4% since the beginning of the year.

courtesy: kitco.com

courtesy: kitco.com

Will Silver Plunge Below $15 or Rally Back Over $50?

1881-CC-Morgan-DollarBy: GE Christenson

Silver prices peaked in April 2011 and dropped about 60% over the next 25 months. Sentiment by almost any measure is currently terrible. Few are interested in silver; most have lost money (on paper) if they bought in the last two and one half years, and the emotional pain seems considerable. It reminds me of the years after the NASDAQ crash in 2000.

So will silver drop under $15 or rally back above $50?

To help answer that question, I examined the chart of silver for the last 25 years and identified several long-term cycles. Then I constructed a spreadsheet that attempted to model the price of weekly silver based on those cycles and a few assumptions.

Assumptions

  • Use only long-term cycles – a year or longer.
  • The weight assigned to each cycle is approximately proportional to its length. A 200-week cycle should be approximately twice as heavily weighted as a 100-week cycle.
  • This is NOT a trading vehicle but a long-term indication of reasonable price projections based on past relationships. Those past relationships may or may not continue, even if they have been valid for over 20 years.
  • Keep it simple. Do not over-complicate the model or aggressively “curve-fit” it.
  • Prices are assumed to rise more slowly than they fall, so 62% of the cycle is related to the rising portion of the cycle, and 38% of the cycle is related to the falling portion of the cycle.

Data

Low-to-Low cycles: 65 weeks, 72 weeks, and 234 weeks
High-to-High cycles: 102 weeks
Exponential growth: 1/1/1990 – 6/30/2002: no growth – 0.0%/year
6/30/2002 – present: 21% per year, calculated weekly

Process

Find the beginning dates (lows) for the 65, 72, and 234 week cycles, and assign those beginning dates an index value of -1.0. Proportionally increase those index values from -1.0 to +1.0, and then reduce those index values from +1.0 to – 1.0, and repeat for each low-to-low cycle. Use the beginning index value on the 102-week high to high cycle as + 1.0. Extend the proportional increases on all time cycles from -1.0 to + 1.0 so that period takes 62% of the cycle length.

Assign each cycle a weight approximately proportional to the cycle length. Use a beginning value and calculate the exponential increase (0% or 21% per year) for each week, and then add or subtract the percentage changes for each weekly time cycle. Adjust the cycle index weights to obtain the best visual fit on a graph of actual silver prices versus the calculated price of silver.

What Could Go Wrong?

  • The exponential increase might not continue from 2013 forward. I doubt it, but it is possible.
  • The cycles, although relevant for over 20 years, might be less relevant from 2013 forward.
  • The calculated price was “curve-fit” to the actual prices, and that “curve-fit” result might be less accurate from 2013 forward.

Results

Statistical correlation over the last 20 years is about 0.95. The calculated silver price is generally consistent with the actual silver price, even though occasional large variations are clearly evident.

Click on image to enlarge.

Highlights

Calculated low: 2/4/05 at $4.96
Actual low: 5/7/04 at $5.60

Calculated high: 3/17/06 at $13.33
Actual high: 5/12/06 at $14.24

Calculated high: 5/4/07 at $18.13
Actual high: 3/14/08 at $20.66

Calculated low: 12/12/08 at $8.15
Actual low: 10/24/08 at $9.30

Calculated high: 3/2/12 at $42.98
Actual high: 4/29/11 at $48.59

Calculated low: 5/10/13 at $23.32
Actual low: 5/17/13 at $22.25 (actual weekly low, so far)

The Future

This simple model, which uses only four cycles and an exponential increase, indicates that a low in the silver price was expected approximately February – July 2013 and that the next high is expected approximately Mar – October 2014 in the $50 – $60 range. Further, the model suggests that a silver price of $90 – $110 is possible in the September 2015 – March 2016 time period.

Caveats!

There are many. This is not a prediction, it is simply a projection based on the entirely reasonable, but possibly incorrect, assumption that silver prices will continue to rise about 20% per year, on average, and that these four cycles will push actual prices well above and below that exponential growth trend.

Why will silver prices continue to increase? Our current monetary system depends upon an exponentially increasing debt and money supply. It seems likely that the US government will continue to run massive budget deficits and thereby increase total debt. In addition, the central banks of Japan, the EU, and the US will continue to monetize debt and increase the money supply to promote asset inflation and to overwhelm the deflationary forces in their respective economies. Silver supply increases slowly, the demand increases much more rapidly, while each Dollar, Euro, & Yen purchase less, on average, each year. It seems quite reasonable to expect that silver (and gold) prices will increase substantially from their current low level. Read: Silver – A Bipolar Roller Coaster.

Timing

The model was basically correct (over the last decade) on timing and price with some large variations. Clearly there are more factors driving the price of silver than four simple cycles. Those political, emotional, and economic factors will push the price higher or lower, sooner or later, than the model indicates. Regardless, it has some value indicating the approximate price and timing for long-term highs and lows in the price of silver.

Use it while appreciating its limitations. Read: Back To Basics: Gold, Silver, and the Economy.

GE Christenson
aka Deviant Investor