April 26, 2024

Gold Bullion Coin Sales Steady In May But Plunge From Previous Year

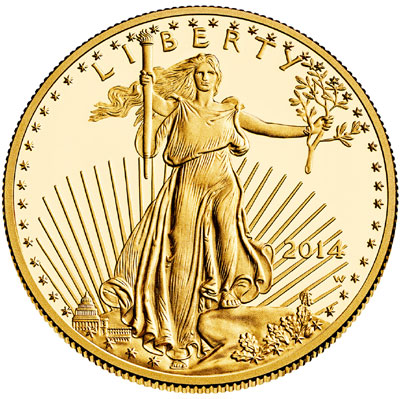
2014-proof-gold-eagleThe sale of gold bullion coins by the US Mint remained steady in May compared to the previous month but declined sharply from year ago levels.  There are numerous theories on why gold demand and prices have not recovered in 2014.

The world seems to have regained confidence in paper money despite the fact that the financial system is now more leveraged than before the financial crisis and the debt problems which caused the financial crisis have simply been papered over with more debt.  Meanwhile, investors in both the stock and bond markets perceive risk to be low and the bulls outnumber the bears by a margin reminiscence of the pre-crash year of 2007.

The only asset class with a preponderance of bears seems to be precious metals.  When the crowd is leaning in one direction, it’s a perfect setup for an eventual price reversal suggesting that long term precious metal investors currently enjoy the opportunity to be greedy when others are fearful.

Despite the constant bearish rants, gold has been relatively stable during 2014.  After starting the year at $1,225 per ounce gold reached a high of $1,385 on March 14 and is currently at $1,244.50 for a gain of 1.6% on the year.

Gold Bullion U.S. Mint Sales Since 2000 as of May 31, 2014
         Year                            Ounces Sold
2000 164,500
2001 325,000
2002 315,000
2003 484,500
2004 536,000
2005 449,000
2006 261,000
2007 198,500
2008 860,500
2009 1,435,000
2010 1,220,500
2011 1,000,000
2012 753,000
2013 856,500
2014 217,500
TOTAL                                                9,076,500

During May the US Mint reported sales of 35,500 ounces of the American Eagle gold bullion coins, down from 38,500 ounces in the previous month.   Gold bullion coin sales plunged from last May when the Mint sold a total of 70,000 ounces.

Since monthly gold bullion coin sales can vary dramatically a look at the average monthly and year to date sales can give a more enlightened view on demand.  As of May 31, 2014 a year to date total of 217,500 ounces of gold bullion coins were sold by the Mint compared to 572,000 ounces in the comparable year ago period, a decline of 61.8%.  Average monthly sales of gold bullion coins during 2014 through May 31 were 43,500 ounces compared to 114,000 ounces last year.

Based on year to date sales, annualized sales of gold bullion coins for 2014 are projected at 522,000 ounces or a decline of 39.1% from the 856,500 ounces sold during 2013.
Silver Remains in a Tug of War Between Supply and Demand

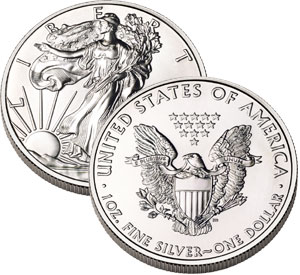
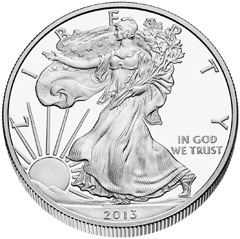
proof-silver-eagleAfter a fierce correction from the highs of 2011 have  the market forces of supply and demand resulted in a stabilized silver price?

On the demand side the industrial use of silver is at a nine year high with fabrication usage expected to rise to over 890 million ounces.   A wide variety of businesses use huge amounts of silver in the production of such items as jewelry, solar panels, electronics, cars, tableware, and photography.

Although silver is most commonly associated by many people as a precious metal investment the industrial demand for silver far exceeds investment demand.  For example, sales by the U.S. Mint of the ever popular American Eagle silver bullion coins hit a record last year of almost 42 million ounces (see Silver Bullion Coin Sales Soar) but this amount is a fraction of industrial usage. Since 2000 to date the U.S. Mint has sold over 292 million one ounce American Eagle silver bullion coins which amounts to only 32% of  estimated industrial demand for just one year.

Even as industrial demand for silver booms, Bloomberg News reports that investment demand for silver has diminished due to tapering of quantitative easing by the Federal Reserve, reduction of the safe haven appeal of silver, reduced demand by China, and the correlation coefficient between gold and silver.

Silver is being undermined by its association with gold.

gold-bullion

While makers of everything from jewelry to solar panels are buying the most silver in nine years, prices are languishing. Investors are dismissing industrial demand and instead focusing on the waning appeal of precious metals as a haven, with the Federal Reserve paring economic stimulus measures, inflation muted and equities rallying.

Silver has been dragged down by a yearlong slump in gold, the commodity most widely held by investors in exchange-traded funds, following a decade-long rally that saw prices for both surge more than sixfold. The five most-accurate precious-metals analysts tracked by Bloomberg over the past two years predict silver will average $18.80 an ounce in the third quarter, the lowest since 2010, and gold will drop 7.3 percent.

“The industrial driver can help, but I don’t think it’s as influential as the investor,” said Robin Bhar, head of metals research at Societe Generale SA in London and the most-accurate forecaster tracked by Bloomberg. “Investors were bullish silver because gold was in a bull market. Now that we have gold in a bear market, there’s less enthusiasm coming from investors.”

The correlation has been strong. From December 2008 to June 2011, silver tripled and gold surged 70 percent, with both touching all-time highs, as the Fed pumped more than $2 trillion into the financial system and cut interest rates to a record in a bid to boost the economy. Last year, when signs of economic growth sent gold down 28 percent, silver plunged 36 percent. The declines were the most for both metals since 1981.

Goldman said in an April 13 report that in the long term, silver tends to track gold, and its forecast reflects the historical ratio to gold. An ounce of gold bought 67.21 ounces of silver in London on April 30, the highest since July. The average over the past 30 years is 64.8.

The link with gold is stronger than that with industrial metals. The mean of silver’s 30-week correlation coefficient to gold was 0.86 over the past five years, compared with 0.51 with the London Metal Exchange Index of industrial metals, data compiled by Bloomberg show. A figure of 1 means two assets always move in the same direction.

“The precious-metal characteristic is likely to dominate,” said Barnabas Gan, an analyst at Oversea-Chinese Banking Corp. in Singapore, and the second-most accurate precious metals forecaster over the past two years. “The risk of higher real interest rates may likely magnify in the middle-long run, and thus raises the opportunity cost for holding silver. The improving global economic picture is also likely to pale safe-haven demand.”

Concern over the value of haven assets is trumping signs that industrial demand is improving. Half of silver supply is used to make things, more than the 10 percent for gold, and demand is picking up as economic growth fuels sales of electronics and cars from China to the U.S.

Since precious metals generally earn returns only through price gains, silver investors were “disillusioned” by the slump over the past year and put their money elsewhere, New York-based researcher CPM said in an April 29 report. Investment demand tumbled 42 percent last year to 105.3 million ounces, the lowest since 2008, according to CPM, which forecast average prices in 2014 will be lower for a third straight year.

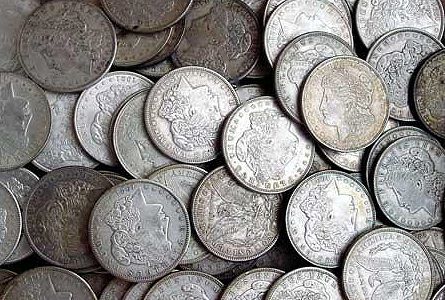
SILVER DOLLARS

At the same time, fabrication usage including by makers of cars, jewelry and tableware will rise 2.9 percent this year to 890.7 million ounces, the most since 2005, CPM said. Silver content is increasing in vehicles with more electronics, according to Metals Focus Ltd., a London-based research company. After dropping last year, demand from electronics and battery makers will rebound in 2014, CPM forecasts.

Most industrial metals will get a boost from growth. The world economy expanded 2.1 percent in 2013 and will increase 2.8 percent this year and 3.1 percent in 2015, according to economists surveyed by Bloomberg. While that will help spur a 2.1 percent gain in industrial and photographic demand for silver, investors will sell 250 metric tons from funds backed by the metal, Barclays Plc estimates.

“Silver is not benefiting even though it has so much industrial use as people still call it a precious metal,” James Paulsen, the Minneapolis-based chief investment strategist at Wells Capital Management, which oversees about $357 billion in assets, said. “Its a tug of war between its safe-haven appeal and its use as industrial metal.”

Hedge funds have cut their bets on higher silver prices by 90 percent in the past two months on the Comex in New York, holding a net-long position of 2,620 futures and options in the week to April 22, U.S. Commodity Futures Trading Commission data show. The five-year average is about 20,510 contracts.

Despite a huge appetite for silver by industrial users, the reduction of investment demand and a production oversupply may continue to pressure silver prices. During 2014 HSBC is projecting an increase in silver supply to 1.09 billion ounces with demand remaining flat at 938 million ounces.

Until the financial system blows up again, the tug of war between supply and demand in the silver market is likely to restrain silver prices for the immediate future.

Sales of Platinum American Eagle Coins Slow Down After Fast Start

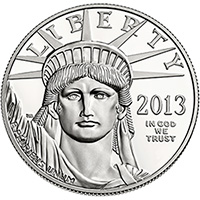
2013 Platinum ProofUS Mint Resumes Production of American Eagle Platinum Bullion Coin

The United States Mint first began minting the American Eagle platinum bullion coin in 1997 but suspended production in late 2008 when demand for gold and silver bullion coins skyrocketed in the wake of the financial crisis.  With its production capacity strained by huge investor demand for gold and silver coins, the US Mint decided to suspend the production of platinum coins.

In 2007, the year before suspending production, annual sales of the platinum bullion coin totaled only 9,050 ounces.  During 2008, the platinum bullion coin was sold up until November and a total of 33,700 ounces of coins were sold.  The coin had been available in one ounce, one-half ounce, one-quarter ounce, and one-tenth ounce sizes with legal tender values of $100, $50, $25, and $10, respectively.

In addition to the bullion version of the American Eagle platinum coin a numismatic proof version of the coin was also available from 1997 to 2008 in all four sizes.  Despite suspending production of the bullion platinum coins in 2008 the Mint continued to annually produce one numismatic version of the platinum coin for collectors.  The numismatic proof version of the platinum coin undergoes a specialized minting process at the Mint where they are struck multiple times with special dies that result in the coin having a softly frosted finish with detailed images that seem to float above the mirror like surface of the coin.

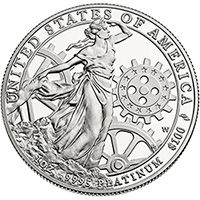
AE Platinum Proof Reverse

AE Platinum Proof Reverse

The 2014 American Eagle Platinum bullion coins are produced by the West Point Mint and only come in a one ounce size.  In March, the first month that the coins were available, the Mint sold 10,000 coins as authorized purchasers built up inventories for sale to the public.  Just as with the American Eagle gold and silver bullion coins, the public cannot buy them directly from the Mint but must purchase them through US Mint authorized purchasers or coin dealers.  April sales of the platinum bullion coins totaled only 1,200 ounces.

Platinum is one of the rarest of precious metals with annual production through mining and recycling of only about 7 million ounces.  The vast majority of all platinum mined comes from South Africa and Russia both of which have unstable political situations which has resulted in frequently curtailed production.  Platinum consumption is expected to exceed supply during 2014 with the deficit coming out of platinum stocks.

Resumption of the production of platinum coins by the US Mint now allows investors the opportunity to diversify their precious metal holdings

Gold Bullion Coin Sales Rise, Silver Bullion Coin Sales Could Hit All Time Record High in 2014

american-silver-eagleGold and silver bullion coin sales by the U.S. Mint during April turned in mixed results with gold sales up and silver sales down.  Despite the fact that gold and silver are in the bargain basement due to price declines, investment demand remains relatively subdued due to tapering of money printing by the Federal Reserve and the apparent recovery of the U.S. economy.

Investor perceptions of precious metals as a safe haven appear diminished despite the ongoing and unprecedented monetary easing by central banks and unrestrained government borrowings.  Gold began the year selling for $1,225 per ounce.  After reaching a high of $1,385 on March 14 gold  declined to a current price of $1,281.25 leaving it up on the year by 4.6%.

The U.S. Mint reported that sales of the American Eagle gold bullion coin in April totaled 38,500 ounces up 83% from 21,000 ounces sold in the previous month but down by a substantial 81.6% from April of 2013 when the Mint sold 209,500 ounces.  After dropping for three years in a row since 2009, sales of the American Eagle gold bullion coins increased in 2013 to 856,500 ounces up by 13.7% from total sales of 753,000 ounces in 2012.

(Sales figures for gold bullion coins on the charts below are as of April 30, 2014.)


Gold Bullion U.S. Mint Sales Since 2000
         Year                            Ounces Sold
2000 164,500
2001 325,000
2002 315,000
2003 484,500
2004 536,000
2005 449,000
2006 261,000
2007 198,500
2008 860,500
2009 1,435,000
2010 1,220,500
2011 1,000,000
2012 753,000
2013 856,500
2014 182,000
TOTAL                               9,041,000

Total sales of gold bullion coins year to date total 182,000 ounces.  Based on the current sales rate through April 30th, annualized sales of gold bullion coins would come in at 546,000 ounces, the lowest amount of sales since 2007 when only 198,500 ounces were sold.

Silver Bullion Coin Sales Could Reach Another Record in 2014

Sales of the American Eagle silver bullion coins remained strong in April with a total of 4,590,500 coins sold, down slightly from the previous month’s sales of 5,354,000.

The one ounce American Eagle silver bullion coin remains extremely popular with investors.  Total coin sales during 2013 reached an all time high of 42,675,000.  The previous record sales year going back to 2000 occurred in 2011 when investors scooped up 39,868,500 coins.  If the current sales pace continues, total sales of the silver bullion coin during 2014 could reach a record breaking 55 million ounces.

Why Gold and Silver Could Outperform Every Other Asset Class in 2014

gold-buffaloAfter almost a three year bear market in gold and silver it’s safe to conclude that most of precious metal bears have sold out and moved on.  As gold and silver prices corrected sharply over the past three years, the chorus of bearish sentiment in the mainstream press has become endemic, thus setting the stage for a powerful and unexpected contra rally.

What will set off an explosive rally in precious metals remains to be seen but there are plenty of potential triggers including war in the Ukraine or South Korea as well as the significant financial risk of collapsing asset bubbles engineered by the extremely loose monetary policies of the world’s central banks.

Here’s some of the most interesting recent commentaries on why 2014 could be a big year for gold and silver.

Gold and Silver Are Almost Ready to Rally

While every journey does begin with the first step, we need more evidence than a minor rally day to declare that a bull market has arrived. For the SPDR Gold Trust ETF (ticker: GLD), the April 24 rally was not very remarkable other than the fact that the day started with a loss and ended with a gain.
Now let’s talk about what it was rather than what it wasn’t.

For starters, it was an encouraging hold of short-term support from March. And the failure to set a lower low for the current two-month decline also falls on the bullish side of the ledger.

But more importantly, it was a suggestion that prices will not travel to the bottom of a giant year-long trading range again. In other words, any further strength now would tell us that investors are ready to buy. They will not wait for “better” prices to buy at the bottom of the range, and that means a shift in sentiment for the better.

Finally, the gold market has a “golden cross” in place. This is a condition where the 50-day average crosses above the 200-day average, and while it is really a stock market indicator, the macro look and feel are the same to me. After a long decline and period of sideways movement, this is the market’s first sign it has had enough healing. As long as the sideways trading range is not so long that the averages are completely flat, I think the signal is worthy of respect.

We can also we look at rising momentum indicators as bullish. Weekly charts show the relative strength index (RSI) setting higher lows between June and December even as prices set equal lows. This means the bears were tired as 2013 ended, and the fact that this indicator continued to rise this year suggests the bulls are starting to wake up.

Silver also had a bullish short-term reversal last week, but it has a lot more technical damage to repair. It does not have a moving average golden cross in place, and has already fallen rather close to its previous major lows from last year. Generally, that’s not a good sign, but in this case it’s not so clear cut.

When we look at the bigger picture using the iShares Silver Trust (SLV), we will see something really interesting. Recall 2010, when both gold and silver shot higher, but silver moved at a much faster pace than gold did. On the charts, we can see the technical launching point and breakout in August of that year.

As we see in many markets that appear to be bubbles, with such steep gains and ever-accelerating trends, the “bubble” part of the rally is often completely erased before conditions stabilize and then improve. Silver’s rally is now erased, which means the market is likely washed out and left for dead. Even so, there is a bullish RSI condition in place for the white metal, just as there is for gold.

 The Long Goodbye – by Andy Xie

The recent tumbling of Internet and biotech stocks may indicate that the speculation in such stocks has peaked. But, unlike in 2000, the bursting will occur in slow motion. The financial market structure has radically changed in the past 15 years. Too many money managers have a one-sided incentive to long such stocks.

The global financial system has experienced one bubble after another because major central banks have kept monetary policy loose. Prolonged loose monetary policy has made the financial system extraordinary large relative to the real economy. This change forces central banks to respond to negative shocks, like the bursting of a bubble, from the financial system. Such responses make the financial system even bigger. This vicious cycle explains why speculation has become such a powerful force.

A bubble cannot expand forever, even in an environment of loose monetary policy. The balance between fear and greed can tip over when the price of an asset becomes too high, like Internet stocks now relative to the average. The subsequent deflating bubble, in a continuing environment of loose money, just shifts air into other assets.

The talk of monetary tightening in the United States or China will not be followed up with strong enough actions. Real interest rates will remain negative until another crisis, like high inflation or hyperinflation or political crisis, force the hand.

Gold is the safe asset in today’s environment. As paper currencies lose credibility, the demand for gold will surge. The alternative digital currencies are fool’s good, really scams to take advantage of people’s fear over the potential collapse of paper currencies.

Two changes in the past 15 years have made bubble formation a constant feature of financial markets around the world. The inefficiencies in capital allocation and income redistribution to finance are the main reason for today’s sluggish global economy.

At the macro level, globalization has made inflation slow to emerge, as multinational companies can shift production around the world in response to cost pressure. This force has given central banks more room in increasing money supply without facing the inflation consequences for years. Hence, central banks around the world have become more active in response to economic fluctuations. The consequence is a rising ratio of money supply or credit to GDP. By definition, this means a bigger and bigger financial system, which needs more and more income to survive.

The real economy, as the previous analysis indicates, can only bear so much. Bubble formation has become central to supporting a bloated financial system. A large and bubbly financial system is unstable. Its periodic collapse brings down the economy, which triggers more monetary stimulus. Hence, constant monetary stimulus and an ever-expanding and bubbly financial system have formed a vicious cycle.

What’s Up With Gold and Silver? (Market Anthropology)

Anecdotally, we are seeing and hearing from those anxiously long the precious metals sector and contentiously short. With gold and silver down sharply in the early morning session – then reversing violently higher, the emotional spectrum in the market is likely diverged at or near another extreme. Over the past 10 months, both bulls and bears alike have been waiting for the next leg to commence. Instead, the market has played the jester – traversing a narrowing range and taking turns at frustrating both sides.

When will the argument resolve itself ?

Although it’s felt like a standing room only performance of Waiting For Godot, we expect long-term yields still hold the key to the next chapter for precious metals and the broader market story. We continue to view the move in 10-year yields as historically stretched to a relative extreme (see chart), a notion apparently lost on many participants as the Fed tapers their way to the end of QE and through an esoteric Fed cycle.
Just this week we saw that a Bloomberg survey of 67 economists unanimously expected 10-year yields to rise over the next six months (see Here). From a contrarian point-of-view, this should wake up participants that underlying sentiment is dangerously listing towards one side and the downstream and kinetic effects could be severe in many markets. The ratio chart below depicts the relationship between gold and 10-year yields, which as we noted last December had also reached a historic extreme. If and when long-term yields breakdown, we suspect a much stronger tailwind to develop behind precious metals.

As the Nikkei was breaking down at the start of the 1990’s, risk appetites changed and developed a palette for the Nasdaq. After the Nasdaq cracked going through the Millennium, investors turned to precious metals. The cycle can also come full circle, as we believe the performance and seasonal presentments of the current risk du jour describes. As the biotech index now turns down just past its zenith, we expect silver and the precious metals sector to begin making their way materially out of the trough they have trended towards over the past three years.

The Reformed Broker

Jeff Gundlach looks at the gold market. He’s not a big gold guy, but says that if you’ve held it this long (and through this much pain), “for god’s sake don’t sell it here!” He thinks the holders who remain are the quintessential, proverbial “strong hands” and that gold miner equities are completely underpriced for the potential of the metal running back up again. He’s more positive on commodities now in general, given how uninterested the investment community seems to be.

http://www.thereformedbroker.com/wp-content/uploads/2014/04/25.jpg

14 Tough Questions Gold Investors Have for the Federal Reserve

Liberty-EagleBy: GE Christenson

“Those who cannot remember the past, are condemned to repeat it.” George Santayana.

1. What mistakes from the past are we condemned to repeat?

2. Since unbacked paper currency systems have always failed in the past, why have bankers and economists promoted an unbacked paper currency system since 1971?

3. Would the Federal Reserve, which is owned by private banks, seek to enrich its member banks and the financial elite by implementing monetary policies such as QE that purchase distressed bank assets and boost the stock and bond markets?

4. Janet Yellen is the new leader of the Fed and new leaders are almost always confronted with a financial crisis early in their term. What should we expect during the next 18 months?

economic collapse

5. ALL paper money systems have eventually failed due to excessive “printing” of the paper currency. How many years of “printing” $85 Billion per month qualifies as excessive “printing”?

6. Human nature changes very slowly if at all. Politicians have lied to most of the people most of the time during the past several thousand years to serve their own self-interest. Are politicians currently lying about ObamaCare, strength of the economy, employment, the NSA, big banks, the IRS, Syria, and so much more?

7. Why does gasoline currently sell for approximately $3.50 per gallon even though it cost only $0.15 per gallon about 50 years ago? Why does a cup of restaurant coffee no longer sell for $0.10? Why do $20 gold coins containing nearly an ounce of gold now sell for over $1,250?

8. The S&P 500 Index is trading near an all-time high and is by most measures and sentiment severely over-bought on a weekly and monthly basis. Is it ready to correct downward?

9. Why is the official unemployment rate falling even though fewer Americans are working and the labor participation rate is at 30 year lows?

10. The Federal Reserve has been levitating the stock market and bailing out banks. Is it possible the Fed policies will backfire and those policies will eventually accomplish the opposite of what the Fed wants?

11. If the national debt of $17 Trillion can never be repaid, and if the U.S. government must borrow to pay the interest every year, and if the Federal Reserve must “print” those dollars, what is the real value of that debt? Is it $17 Trillion or perhaps a great deal less? The economist Hyman Minsky called this “Ponzi Finance” – the final stage of a debt based economic system when payments on the debt must be made from additional borrowing.

money printing

12. If a soaring gold price encouraged people to question the value of the U.S. dollar, and if the U.S. government had the means to suppress the price of gold, would the U.S. government manipulate the price of gold lower?

13. Germany requested their gold be returned from the NY Federal Reserve vaults about a year ago. It has NOT been returned. What happened to the German gold? Further, how much, if any, of the gold supposedly stored in Fort Knox is physically there and not “leased” or otherwise encumbered?

14. Gold has been money – a store of value, divisible, a medium of exchange, a unit of accounting, and intrinsically valuable – for 5,000 years. Paper money has usually been little more than a politician’s promise of integrity and responsibility. Which do you trust – gold or a politician’s promise?

These questions and their answers suggest that:

Drastic restructuring of the current monetary system seems inevitable, whether or not it is imminent.

Before the system resets it seems likely that governments around the world will scramble to locate and nationalize assets in order to maintain their power for a while longer. Capital controls and financial repression via artificially lowered interest rates are already in place. Pension plans, savings accounts, and IRA and 401(k) plans seem vulnerable to partial confiscation, bail-ins, or mandatory investment in government bonds. Such confiscations and bail-ins have already occurred in other parts of the world and could easily happen in the United States.

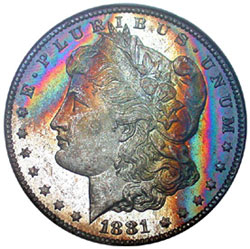
toned-morgan-dollar

Gold and silver have protected purchasing power and assets for 5,000 years. In this twilight period of the current debt based monetary system it seems likely gold and silver will increasingly be necessary for protection of purchasing power and assets. Are you prepared?

GE Christenson

aka Deviant Investor

Gold and Silver Can Defeat Government Taxes, Corruption and Theft

gold-buffaloBy: Vin Maru, TDV Golden Trader

As everyone rings in the New Year with a toast and a cheer for a prosperous 2014, Wall Street started celebrating many months ago and is ringing in the New Year with a glass of Dom Pérignon. They surely have a reason to celebrate as 2013 brought them good fortune and financial prosperity, having rung in the New Year with new all time highs on many of the US-based major indexes.

While there are many ways to measure prosperity, for Wall Street it’s all about profits and the bottom line. They only know one thing, how much wealth they can steal from others by “gaming” the system. I say “steal” because today’s markets are no longer about valuations and true price discovery. It’s more about computer algorithms, access to unlimited funds, having insider knowledge on buy and sell orders, front running the average investor and the ability to extract risk free profits by gaming the system. Of course this is nothing new for big Wall Street investment houses; over the last decade they have mastered the art of investing by gaming the system and extracting wealth from others.

Financial prosperity in today’s world means having the Federal Reserve central bank in your corner ready to bail you out in case any of your bets go bad. Becoming “Too Big to Fail” is a necessity to financial survival and having the regulators in your pocket also helps. Of course, we can’t forget about using extreme leverage, derivatives, credit default swaps and futures to squeeze some additional profits from the system.

With all these tools and means to game the system, investment banking for profit becomes a game of how much wealth you can steal from others before you get caught with your hand in the cookie jar. Of course when you do get caught, all you get is a slap on the wrist in terms of fines and penalties. If you get caught laundering money, rigging interest and foreign exchange rates — no problem, there is a fine for that, as long as you are one of the “Too Big to Fail” banks.

Today’s financial system is setup to steal your wealth. The bankers steal from you by rigging the system for their gain, and then the government fines the bankers for stealing. In order to maintain banking control and growth, the bankers have to resort to rigging the game even more so they maintain profit growth. This corrupt system of theft is definitely a win win situation, a win for the bankers and a win for the government, it’s only the average person who loses by having their pockets picked.

We can’t blame all of this on the bankers, the corruption in the Western financial world runs right to the root of the problem, government. By allowing central banking to exist, governments can ensure their own financial safety net and survival from having a system which continuously prints money to fund deficit spending. To remain in power, Government’s control only exists and grows because of taxation and the rules and regulations they impose on their citizens. Take France for example, their constitutional council and highest court just gave the green light to Hollande to introduce a top tax rate of 75 percent on earnings over one million Euros.

Of course, the most corrupt government in the world is the United States. Having the status of the world’s currency reserve empowered them to build the biggest army, thus giving them the ability to bully any other nation state by way of force or death. And if they don’t attack you directly, they surely will spy on you electronically via the NSA and they will definitely tax and fine you for non-compliance to their rules and regulations.

I always wondered if the US will ever get their deficits under control and how they will reduce their debt burden. One way for sure is that the US will tax and regulate their way out of financial debt by taking wealth that was hidden from them. After reading an article on how Swiss regulators recommended banks take provision for US tax deal, it became pretty obvious that all international bankers will be forced to comply with the US regulators or get shut out of their system.

The real irony of the situation is how this system is gamed right from the beginning to end, which then comes full circle to help governments. The bankers have been cashed up via the central banks and are making tremendous profits trading rigged markets. All this new wealth now on the banker’s balance sheet will be heavily taxed over the coming years and used to pay off fines imposed on them by governments and regulators.

proof-silver-eagle

In short, the corruption in US banking to help government finances, spending and debts goes like this:

  • The Federal Reserve central bank print money from nothing.
  • The CB then gives this newly printed money to big banks to buy US debt.
  • The “To Big to Fail” banks then sell the US debt back to the Fed (for a nice profit) and receive more money.
  • The big banks who are now cashed up, conduct proprietary trading to rig markets for even more profits.
  • All this extra ill-gotten cash sitting with the banks is then taxed, and/or regulated and fines are imposed for illegal rigging of markets.
  • This money is then given back to the US government which probably helps extinguish some debt or pays for gov’t expenses.

In this system of corrupt Western finance, the only people that lose are the people or entities who don’t see it happening or can’t take the necessary steps to avoid the theft and confiscation, and then actually profit from it happening. Anyone with savings will also get burned by either the devaluation of fiat currencies or outright theft of deposits at the banks by way of bail-ins or nationalization of retirement savings. Either way, the average person is at a disadvantage in a no win situation if they leave their assets in the western financial system.

The window to get your wealth out of the traditional western financial system is closing. Anyone who does so now will be saved from the ever growing corruption and theft that is coming down the road. Precious metals are one of many assets that should be continuously accumulated now and on any further pullback. At this point the rigged price of the metals is not as relevant as the number of ounces you own and hold outside the financial system, and that window is rapidly closing.

This is why I researched and wrote the special report for TDV called “Getting Your Gold out of Dodge”, to help you protect your precious metals assets. If you are also interested in coverage and trading opportunities in precious metals and technology, you can sign up for the TDV Golden Trader newsletter.

Financial Repression and QE Guarantee A Bleak Future for Retirees

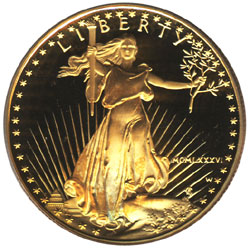
1986-gold-eagleBy: GE Christenson

A mid 60s woman was chatting with two friends at a Starbucks. I overheard the conversation. It went something like this…

“When my husband and I retired, our financial advisor said we had enough money to last until we were both 95 years old. Now he is concerned that our savings might not last until we are 80.”

It gets worse.

“But if either of us dies then our pension income is reduced and the survivor has to make a choice – pay the mortgage or eat.”

It gets worse.

“And we still have to worry about healthcare.” She went on about sky-high health care costs, Obamacare, and her pre-existing conditions that prevented her from changing insurance.”

She probably does not see how much worse it can become.

What is the Problem?

In simple terms the Federal Reserve has lowered short term interest rates to nearly zero (ZIRP – Zero Interest Rate Policy) and is “printing” $85 Billion per month (QE) to bail out bankers and our politicians who can’t balance the government budget or even pass a budget.

So What? Aren’t low interest rates good for the economy and for home prices?

Well, maybe in the short term they appear to be beneficial. The politicians and bankers have assured us of such. But politicians and bankers are benefitting from QE so perhaps we should question their assessment. Consider these points:

Would you loan your money for 30 years to an insolvent government that chronically spends far more than it collects in taxes? Would you consider that 30 year bond a wise investment if the government paid you less than 4% per year? Think back to what your expenses for gasoline, housing, food, and health care were in 1983 to help determine if 4% per year is enough to compensate for your guaranteed higher expenses and for the decline in the value of the dollar in the years to come. (Hint: NO!)

Retirement systems, life insurance policies, annuities, city and state government pensions and so much more depend upon the interest earned from government and corporate bonds, saving accounts, and Certificates of Deposit. If the interest earned over the past five years has been about 1% to 3.5% per year and most pension plans have assumed earnings in the (typical) 7% to 9% range, those pension plans have been underfunded by a larger amount each year. Think California public employees, Chicago public employees, New Jersey, Detroit and so on. Most pension plans for city and state employees are currently underfunded while they are optimistically assuming future interest earnings much higher than the Federal Reserve has repeatedly assured us will be possible.

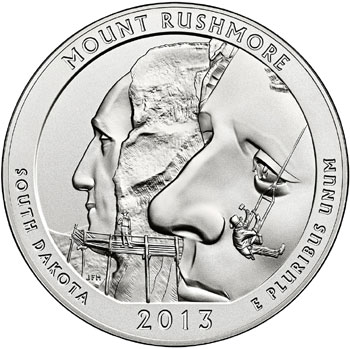
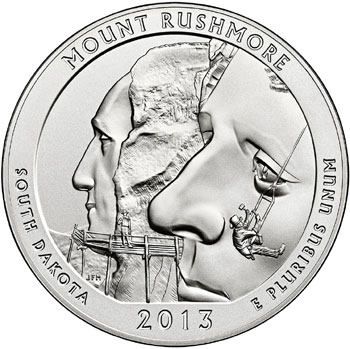
mount-rushmore1

Conclusion

The ZIRP and QE are causing the retirement funds for many governments and corporations to be more underfunded each year. If your retirement comes from a government pension, it is less secure each year. It can’t remain underfunded forever. Ask the retirees from Detroit!

Corporate pension systems invest similarly. If your retirement comes from a corporate pension, it is less secure each year. Ask the retirees from a bankrupt airline or from Enron Corporation.

If your retirement is funded by your personal savings and you have been earning perhaps 1% per year for the past five years, you already know the devastation that ZIRP and QE have caused in your personal finances.

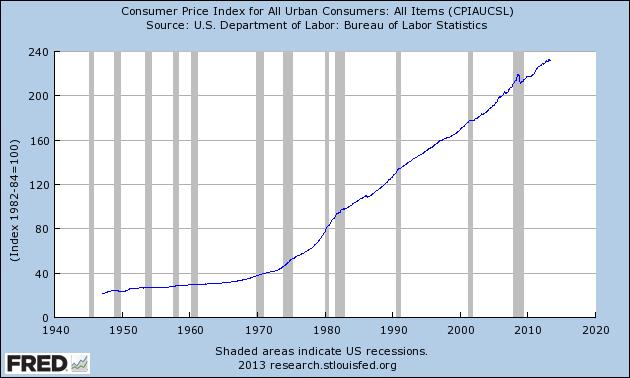
CPI INFLATION

The lady mentioned at the beginning understands that she and her husband are earning much less money in their retirement accounts than their financial advisor had projected, and so their retirement money will not last as long as originally hoped. What she probably does not realize is that her interest income will be kept low for the foreseeable future while her living expenses are very likely to substantially increase. In short, their retirement funds probably will be depleted well before she and her husband reach 80 years old. That is not a happy thought for her family and for millions of others who expected more “normal” interest earnings before the government and The Federal Reserve chose to bail out the financial industry. That bailout occurred at the direct expense of the taxpayers and at the indirect expense of savers, pension plans, and other retirement systems because of the unexpectedly low interest earnings created by the ZIRP and QE.

Karl Denninger has written a highly intelligent piece describing this process and the consequences. Read it for new insights. From that article:

“The bottom line is that QE produces what looks like a ‘benefit’ without cost at the start of the program, but that appearance is a con job.”

“In short at best QE is nothing more than pulling forward the ability to spend paid interest from tomorrow into today but for each dollar pulled forward to today it is taken from tomorrow’s spending.”

“How much harm are we talking about? Well, that’s difficult to determine, because you’d need a blended rate of interest across the entire lending continuum to figure it out. But it is certain that the $3 Trillion added to the Fed’s balance sheet is less than the actual amount pulled forward over that time.”

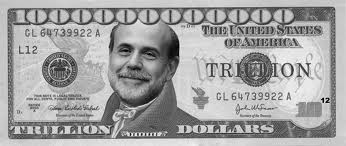
bernanke's paper

Summary

The Fed, through ZIRP and QE, has created $Trillions of benefits for the financial industry and much of that benefit has been created at the expense of government pension plans and individuals who depend upon interest earnings. This has a direct and negative consequence to many retirement plans, especially city and state public pensions.

It is especially destructive to those individuals who depend upon interest earnings to fund their cost of living.

Your savings are unlikely to last as long as you hoped.

Further Considerations

The Fed is “creating” $85 Billion per month for QE. This boosts the financial industry, the stock market and the bond market but the average person realizes little benefit from those markets. The average person is actually hurt by the lower than expected interest earnings in his personal accounts and in the pension accounts from which his pension is paid.

SILVER: The silver market is tiny. In very round numbers about a billion ounces are mined, worldwide, each year. This is approximately $20 Billion per year or only about one week of QE for bond monetization.

GOLD: The gold market is much larger than the silver market but still small compared to the QE process. In round numbers the worldwide annual gold mining market is 3,000 – 4,000 tons or about $ 130 – $170 Billion per year. Two months of QE “money printing” is enough to purchase all the gold mined each year in the whole world.

Does it seem “right or moral” to you that a privately owned central bank prints enough money each WEEK to buy the equivalent of all the silver mined worldwide in a year, or that TWO MONTHS of “printing” would purchase all the gold mined in a year? The politicians and bankers will not change this process but we can adapt to the consequences.

Does it seem likely that dollars, which are printed in excess every month, will retain their value against gold and silver?

Stated another way, does it seem likely that while gold and silver are limited in supply, and while the dollars used to purchase those metals are increasingly debased by both the central bank and the government, that the prices for gold and silver will remain stable or even decline?

The bullish case for gold and silver is reported in the alternate media and by numerous gold and silver “bugs” such as myself. The bearish viewpoint is easily obtained from the mainstream media, Goldman Sachs, and the Federal Reserve. Other intelligent individuals, such as Harry Dent and Robert Prechter, also promote the bearish viewpoint. I find the bearish analysis for gold and silver rather unlikely and often self-serving for those in the financial industry who make their living selling “paper.” But often it is valuable to analyze the perspective of those who disagree with you.

Decide for yourself! Your financial well-being and your retirement may depend on an intelligent assessment of the consequences of more QE, higher or lower gold and silver prices, and booms and busts in the stock and bond markets.

My vote is with gold and silver. Five thousand years of history support that viewpoint. Paper money does not retain its value or purchasing power. Hundreds of years of history support that viewpoint. Further, QE and ZIRP accelerate the decline in the value of paper dollars.

Gold and silver have been moving down, on average, for about 2.5 years. They might even be down another year, however I doubt it. In five years you might earn a total of 5 – 10% in a Certificate of Deposit. By contrast you are likely to double (quadruple or more) your savings if they are invested in gold or silver. Which will be more beneficial to your retirement?

Which sounds safer – gold or paper? Would you prefer something that has retained its value for 5,000 years or unbacked paper money – which has eventually and always declined in value to near zero?

GE Christenson
aka Deviant Investor

Gold and Silver Are in Long Term Uptrends

mount-rushmore1By: GE Christenson

The BIG Perspective: Examine the following “Point & Figure” chart from Ron Rosen. This type of chart plots price on the “y” axis while the “x” axis shows time but without uniform distance between years. The long term trend has been up since 1970 and 2001, while the intermediate trend has been down for the past 26 months.

Gold and silver will outlast hope, change, paper money, treasury debt, and political promises. Most people do not and will not understand why!

The following are logarithmic charts of the official U.S. national debt, gold, silver, and crude oil for the past three to four decades.

Clearly the long term trends are up. Why?

  • A debt based paper currency system must expand to survive!
  • The Fed needs an increasing money supply and more debt.
  • Congress and the administration aggressively spend money, borrow money, and increase the national debt. It will take a real crisis to change this – much worse than a phony debt ceiling crisis.
  • The financial industry wants to churn more paper assets, debt, derivatives, and volatility to increase their profits.

The inevitable conclusion is that, over the long term, money supply, debt, and prices will increase until there is a systemic reset or crash. What will endure throughout the inevitable inflation, deflation, and crash? Gold and silver will endure. Paper assets are only as good as the collateral backing them, and many of those assets could vaporize in a systemic reset. Gold and silver will survive and maintain their value, while the dollar and Treasury Debt may lose a good portion of their value and purchasing power.

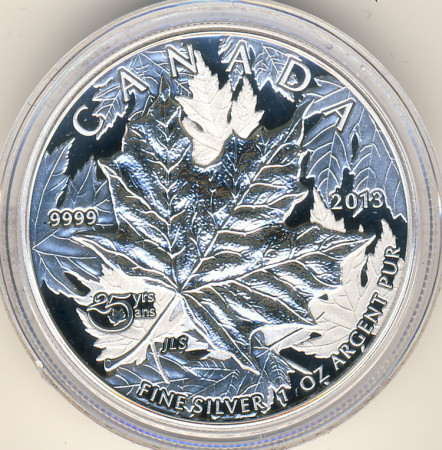
maple-leaf-442x450

Hope & Change

Hope is not a good basis for an investment plan. Hope is not a viable foundation for a political philosophy or for the actions of a government. Hope will not pay the bills, reduce the debt, or return sanity to an out-of-control spending process.

Ask yourself how well these are working:

  • We spent the rent money on lottery tickets and booze. We hope something good happens soon.
  • We spent a few $Trillion on useless wars in the middle-east. We hope it helped.
  • We spent $17,000,000,000,000 more than our revenue. We hope it is not a problem.
  • We sold or “leased” much of our accumulated gold and sent it to China. We hope nobody noticed and that it will not matter.
  • We hope we don’t have another stock market or bond market crash.
  • We hope to increase taxes and reduce benefits while increasing consumer prices and we hope to keep the people happy and voting for the incumbents. (This is also change.)
  • We hope to actually pass a budget real soon. (Congress has not passed a budget in the past five years. Did anyone notice or care?)
  • We hope to reduce the deficit real soon.
  • We hope the Federal Reserve and the politicians will make it all better.
  • We hope that hope and change will begin to work real soon.

As for “CHANGE” – it can be positive or negative. Not all change is good. We “HOPED” for better government and we received Obamacare. Was that a positive change?

Gee, we hope that the 10 Million or so people whose insurance plans will be cancelled and who will be forced to purchase new health insurance policies at much higher rates are okay with the change, increased deductibles and the increased costs. We hope they don’t get upset or angry or think someone lied to them.

Liberty-Eagle
Gold and Silver!

Dr. Phil says that the best predictor of future behavior is relevant past behavior. Using that thought it seems clear that:

  • The official national debt will continue to exponentially increase like it has for more than four decades.
  • The dollar will continue to decline in purchasing power like it has for the past 100 years.
  • Gold and silver will continue to (erratically) increase in price like they have for the past 40 years.
  • Gold and silver will hold their value and purchasing power like they have for 5,000 years.
  • Government deficit spending and borrowing will continue.
  • There will be another budget crisis, and another, and another.
  • Politicians will talk, make promises, and become much wealthier while the middle and lower classes find their expenses increasing far more rapidly than their incomes. We will re-elect those politicians.
  • Hope and change will continue to produce what they have so far – nothing but more debt.

Gold and silver will outlast hope, change, paper money, treasury debt, and political promises. Most people do not and will not understand why!
So, place your bets!

  • Paper currency or gold and silver.
  • Debt based paper assets or real money – gold and silver.
  • Political promises or something of lasting value.
  • Futures contracts on a corrupt exchange or land.
  • Credit card debt or stacked silver in a safe.
  • Social security income in a decade or gold in hand now.
  • Obamacare or good health.
  • Nutritionally empty fast food or healthy nutritious food.
  • Artificial and phony or real and valuable.
  • Reality television or the Holy Bible.

Most people will stick with what they know – paper currency, debt based paper assets, political promises, hope and change, and reality television. The choice is yours, but you will have a better financial future and more peace of mind if you invest in something real and valuable.

GE Christenson
aka Deviant Investor

The Top 10 Biggest Gold Producing Countries in the World

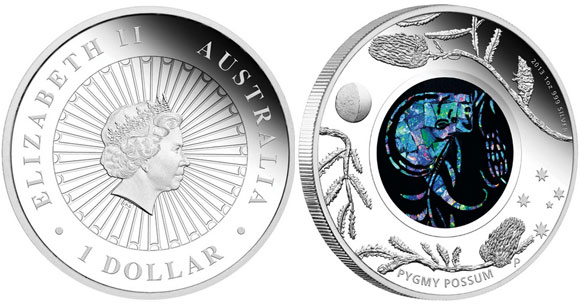
pygmy-possum-coinThe Perth Mint presents a neat infographic on the world’s top 10 gold producing countries.

China, which loves gold more than anything, came in as the number one producer with annual output of 370 metric tons.  According to the latest official numbers from the IMF, China holds the world’s fifth largest reserves of gold with holdings of 33.9 million ounces.  Unofficially, many analysts say that actual gold reserves held by China are far larger than the “officially” reported numbers.

The second largest gold producer in the world is Australia (home of the Perth Mint) which produced 250 metric tons of gold in 2012.

The United States came in at third place with annual production of 230 metric tons.  As a dubious consolation for those who hate to see the U.S. come in third, keep in mind that the United States still reigns supreme in the number one spot for production of paper currency.

The Perth Mint, which has been producing gold coins since 1899 has produced (in my opinion) some of the world’s most artistic gold and silver coins.