March 28, 2024

Gold Bullion Coin Sales Soar 76% In September, Silver Sales Up 13%

According to the latest report from the U.S. Mint, demand for both gold and silver bullion coins during September surged to the highest levels since January.

Total sales of the American Eagle Gold bullion coins during September soared 75.6% to 68,500 ounces from 39,000 ounces in August.  Monthly sales of gold bullion coins have fluctuated widely during 2012 with a high of 127,000 ounces in January and a low of 20,000 ounces in April.   The average monthly sales of gold bullion coins through September is 53,500.

Total sales of the American Eagle Gold bullion coins through September total 481,500 ounces.   Unless sales surge dramatically during the last three months of the year, 2012 will be the fourth year of declining sales of the gold bullion coin.   As detailed below, the all time record for sales of the gold bullion coins was during 2009 when sales exceeded 1.4 million ounces.

Gold Bullion U.S. Mint Sales By Year
Year Total Sales Oz.
2000 164,500
2001 325,000
2002 315,000
2003 484,500
2004 536,000
2005 449,000
2006 261,000
2007 198,500
2008 860,500
2009 1,435,000
2010 1,220,500
2011 1,000,000
Sept-12 481,500
Total 7,731,000

U.S. Mint sales of the American Eagle Silver bullion coins during September totaled 3,255,000 ounces, up 13.4% from August sales of 2,870,000 ounces.

Investor demand for the American Eagle Silver bullion coins has been relatively consistent throughout the year.  After a very strong January during which over 6.1 million coins were sold, demand remained strong with monthly sales well in excess of 2 million ounces except for February when sales slumped to 1,490,000 ounces.  If monthly sales of the American Eagle silver coins continue at the September sales pace, total sales for 2012 will be close to the record year of 2011 when almost 40 million ounces were sold.

Total annual sales by the U.S. Mint of the silver bullion coins since 2000 are shown below.  Sales for 2012 are through September.

American Silver Eagle Bullion Coins
YEAR OUNCES SOLD
2000 9,133,000
2001 8,827,500
2002 10,475,500
2003 9,153,500
2004 9,617,000
2005 8,405,000
2006 10,021,000
2007 9,887,000
2008 19,583,500
2009 28,766,500
2010 34,662,500
2011 39,868,500
Sept-12 25,795,000
TOTAL 224,195,500

The American Eagle gold and silver bullion coins produced by the U.S. Mint can only be purchased by Authorized Purchasers who in turn resell the coins to other dealers and the general public.  Numismatic versions (uncirculated or proof) of the American Eagle series coins can be purchased by the public directly from the U.S. Mint.

Gold and Silver Bullion Coin Sales Jump 25% In August, San Francisco Silver Eagle Set Sold Out

The latest sales figures from the U.S. Mint for August show a significant increase in sales of both gold and silver bullion coins.
Sales of gold bullion coins during 2012 have varied dramatically from month to month with a high of 127,000 ounces in January to a low of only 20,000 ounces in April.  Monthly gold bullion sales through August have averaged 51,625 ounces.

Monthly sales of silver bullion coins have been more consistent during 2012.  The U.S. Mint sold over 6 million ounces of silver bullion coins in January, but the monthly pace has tapered off to under 3 million ounces.  The average monthly sales of silver bullion coins through August is 2,817,500.

American Eagle Gold Bullion Coin Sales

Total sales of the American Eagle Gold bullion coins during August totaled 39,000 ounces, up 27.9% from July’s total of 30,500 ounces.  Total sales of gold bullion coins by the U.S. Mint through August totaled 413,000 ounces, valued at approximately $700 million based on today’s closing gold price.

On an annualized basis, the U.S. Mint will sell almost 620,000 ounces of  gold bullion to investors this year valued at $1.0 billion if the price of gold remains at $1,692.  During 2009, the peak year of gold bullion coin sales by the U.S. Mint, investors purchased 1,435,000 ounces valued at $1.4 billion based on the average price of gold of $972 per ounce.

Investors who have reduced gold bullion purchases due to the increased cost per ounce will no doubt regret this decision as the price of gold continues to increase.  The value of gold should be viewed in the context of the reduced purchasing power of the dollar – as the Federal Reserve constantly destroys the purchasing power of the U.S. dollar, the “dollar cost” of gold will naturally increase.  The price of gold is merely reflecting the fact that paper dollars are worth less and less every day.

As the Fed continues to do what it does, expect the bull market in gold to continue.

Listed below are yearly sales figures for the American Eagle gold bullion coins since 2000.  Sales for 2012 are through August 31st.

Gold Bullion U.S. Mint Sales By Year
Year Total Sales Oz.
2000 164,500
2001 325,000
2002 315,000
2003 484,500
2004 536,000
2005 449,000
2006 261,000
2007 198,500
2008 860,500
2009 1,435,000
2010 1,220,500
2011 1,000,000
2012 413,000
Total 7,662,500

American Eagle Silver Bullion Coin Sales

Sales of the American Eagle Silver bullion coins by the U.S. Mint during August totaled 2,870,000 ounces, up 25% from the July total of 2,278,000 ounces.  Investor demand for silver has remained strong, with many investors taking the opportunity to purchase additional silver below the highs reached during 2011.  Sales of the silver bullion coins remain near record levels and total sales for 2012 should be well in excess of 30 million ounces for the third consecutive year.

Total annual sales by the U.S. Mint of the silver bullion coins since 2000 are shown below.  Sales for 2012 are through August.

American Silver Eagle Bullion Coins
YEAR OUNCES SOLD
2000 9,133,000
2001 8,827,500
2002 10,475,500
2003 9,153,500
2004 9,617,000
2005 8,405,000
2006 10,021,000
2007 9,887,000
2008 19,583,500
2009 28,766,500
2010 34,662,500
2011 39,868,500
Jul-12 22,540,000
TOTAL 220,940,500

U.S. Mint Numismatic American Eagle Gold and Silver Coins

Both the American Eagle gold and silver bullion coins can only be purchased from the U.S. Mint by Authorized Purchasers who in turn resell the coins to other dealers and the general public.  The numismatic versions of the American Eagle series coins can be purchased directly from the U.S. Mint.

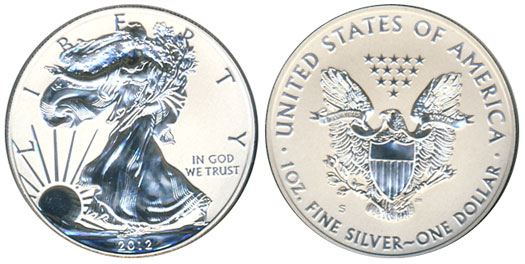
Many of the numismatic silver coins produced by the U.S. Mint attract strong demand and often times, the coins will sell at a premium in the secondary market.  A recent example of this is the 2012 San Francisco Silver Eagle Set.  According to the Mint News Blog:

The 2012 San Francisco Silver Eagle Set was one of the United States Mint’s most anticipated product releases of the year. Each set contained one 2012-S Proof Silver Eagle and one 2012-S Reverse Proof Silver Eagle.

Product sales began on June 7, 2012 at 12:00 Noon ET with pricing of $149.95 per set. Rather than establishing a maximum product limit, as had been done for similar products in the past, the US Mint would accept orders during a four week ordering window and produce the sets to meet the total demand. A sales odometer which was updated daily gave collectors an indication of the progress of the offering. Sales officially closed on July 5, 2012 at 5:00 PM ET. The last indicated sales total was 251,302 sets.

On the secondary market, prices for the sets remain above the issue price. A quick survey of eBay auctions completed within the past few days show the prices realized for raw sets mostly falling into a range of $180 to $190, compared to the issue price of $149.95.

Sets which have been graded by PCGS or NGC and received the top grade of Proof-70 have sold for premiums above raw sets. Sets with the two coins graded PCGS PR70DCAM and PR70 have recently sold for prices around $425 to $450. Sets with the two coins graded NGC PF 70 Ultra Cameo and PF 70 have sold for prices around $300 to $325.

Gold Bullion Coin Sales Plunge 50% In July, Silver Sales Off 20%

The latest sales figures from the U.S. Mint show that sales of both gold and silver bullion coins declined dramatically during July.  While sales of silver bullion coins have remained at historically high levels, sales of the gold bullion coins have been in a steep decline since 2009.
American Eagle Gold Bullion Coin Sales

Sales of the American Eagle Gold Bullion coins during July totaled 30,500 ounces, a 49.2% decline from June sales of 60,000 ounces.  Two previous months of the year had lower gold coin sales than July.  During February 21,000 ounces of gold bullion coins were sold and in April only 20,000 ounces were sold.   The year to date average monthly sales figures for gold bullion coins total 53,428 compared to a monthly average of 83,333 during 2011.

The all time yearly sales record for the American Eagle gold bullion coins was set during 2009 when it looked as if the entire U.S. banking system was about to collapse.  Sales in each subsequent year have been lower than 2009 despite the increase in the price of gold since then.  In 2009 gold closed the year at $1,087.50 per ounce, subsequently hit a high of $1,895 on September 5, 2011 and closed today at $1,615.90 in New York trading.  If sales during 2012 are annualized, total gold bullion coin sales will reach approximately 641,000 ounces, the lowest amount since 2007 when yearly sales came in at 198,500 ounces.

Listed below are yearly sales figures for the American Eagle gold bullion coins since 2000.  Sales for 2012 are through July 31st.

Gold Bullion U.S. Mint Sales By Year
Year Total Sales Oz.
2000 164,500
2001 325,000
2002 315,000
2003 484,500
2004 536,000
2005 449,000
2006 261,000
2007 198,500
2008 860,500
2009 1,435,000
2010 1,220,500
2011 1,000,000
2012 374,000
Total 7,623,500

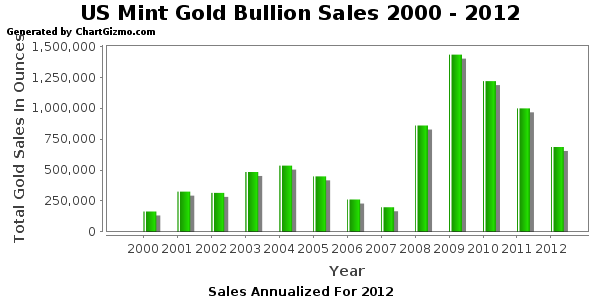
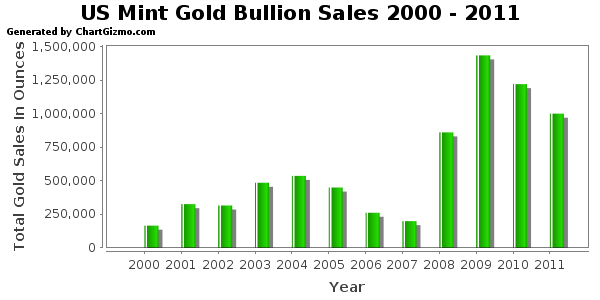
The graph below shows gold bullion coins sales since 2012, with sales annualized for 2012.

American Eagle Silver Bullion Coin Sales

According to the U.S. Mint, sales of the American Eagle silver bullion coins totaled 2,278,000 ounces during July, a decline of 20.3% from June’s total of 2,858,000.   The highest monthly sales of the silver bullion coins during 2012 was 6,107,000 ounces recorded in January followed by the lowest monthly sales of 1,490,000 ounces in February.  Average monthly sales of the silver bullion coins through July was 2,810,000.

The silver bullion coins have showed resilient demand despite the drop in silver prices since mid 2011.  Based on year to date sales figures, total sales of the silver bullion coins could approach 34 million ounces, not far below the record sales figure recorded in 2011 when almost 40 million ounces were sold.

Total annual sales by the U.S. Mint of the silver bullion coins since 2000 are shown below.  Sales for 2012 are year to date totals through July.

American Silver Eagle Bullion Coins
YEAR OUNCES SOLD
2000 9,133,000
2001 8,827,500
2002 10,475,500
2003 9,153,500
2004 9,617,000
2005 8,405,000
2006 10,021,000
2007 9,887,000
2008 19,583,500
2009 28,766,500
2010 34,662,500
2011 39,868,500
Jul-12 19,670,000
TOTAL 218,070,500

The American Eagle gold and silver bullion coins are sold by the U.S. Mint only to Authorized Purchasers who in turn resell the coins to the general public and other dealers.  Numismatic versions of the American Eagle series gold and silver coins can be purchased by the public directly from the U.S. Mint.

Gold Bullion Coin Sales Up 13% In June, Silver Bullion Coin Sales Remain Steady

According to the latest report from the U.S. Mint, sales of gold bullion coins increased by over 13% during June, while total sales of the silver bullion coins were essentially unchanged from May.
Monthly sales of the American Eagle gold bullion coin have fluctuated considerably during 2012 with sales reaching a monthly high of 127,000 ounces in January and a monthly low of 20,000 ounces in April.  Sales rebounded strongly in May to 53,000 ounces and continued higher in June with the sale of 60,000 ounces.

Sales of the American Eagle gold bullion coin can vary dramatically from month to month based on many factors.  The all time yearly sales record for the gold bullion coins of 1,435,000 ounces was reached in 2009  when many people feared that the financial system would collapse.  Sales volume of the gold bullion coins have not, however, had a direct correlation to the price of gold.  Gold closed 2009 at $1,087.50 per ounce and subsequently went on to hit a 2011 high of $1,895 on September 5th.  Despite the fact that gold increased by over 74% since year end 2009, total gold bullion coin sales declined in both 2010 and 2011.

If the European financial storm continues to unwind into a collapse similar to what we experienced in 2008, sales of the gold bullion coins could easily expand dramatically over the record levels seen in 2009.  With each passing day, there seem to be fewer reasons to maintain confidence in the paper money system as central bankers and governments attempt to prop up a debt burdened world economy with additional debt and money printing.

Listed below are the yearly sales of the American Eagle gold bullion coins since 2000.  The total for 2012 is through June 30th.

Gold Bullion U.S. Mint Sales By Year
Year Total Sales Oz.
2000 164,500
2001 325,000
2002 315,000
2003 484,500
2004 536,000
2005 449,000
2006 261,000
2007 198,500
2008 860,500
2009 1,435,000
2010 1,220,500
2011 1,000,000
2012 343,500
Total 7,593,000

If the sales trend of American gold bullion coins continues on the pace it has been on thus far, 2012 may turn out to be the fourth year in a row of lower sales.  The graph below shows gold bullion coin sales since 2000 with figures for 2012 annualized based on sales through June 30th.

U.S. Mint sales of the American Eagle silver bullion coin continued strong in June at 2,858,000 ounces, down slightly from the May total of 2,875,000 ounces.  After a strong start in January with sales of over 6 million ounces, sales dipped below 2 million ounces in February and April.  Year to date sales through June 2012 of the silver bullion coins total 17,392,000 ounces, down by 22% from the comparable sales period in 2011 when 22,303,500 ounces were sold.

If sales of the silver bullion coins continue at the same pace for the remainder of 2012, total sales could exceed 34 million ounces, not far below the record set during 2011 of 39.9 million ounces.   Considering that silver has corrected in price from $48.70 reached during April of 2011, the volume of silver bullion coin sales is very robust, with buyers taking advantage of lower prices.

In addition to gold and silver bullion coins, the U.S. Mint sells numismatic series of both gold and silver American Eagle coins which the public can purchase directly from the U.S. Mint.  Bullion versions of the gold and silver American Eagles are only sold to Authorized Purchasers who in turn resell the product to the general public and other dealers.

Total annual U.S. Mint sales of the American Silver Eagle bullion coins since 2000 are shown below.  Sales totals for 2012 are through June 30th.

American Silver Eagle Bullion Coins
YEAR OUNCES SOLD
2000 9,133,000
2001 8,827,500
2002 10,475,500
2003 9,153,500
2004 9,617,000
2005 8,405,000
2006 10,021,000
2007 9,887,000
2008 19,583,500
2009 28,766,500
2010 34,662,500
2011 39,868,500
2012 17,392,000
TOTAL 215,792,500

Gold and Silver Bullion Coin Sales Rebound Strongly In May

According to the latest report from the U.S. Mint, sales of both gold and silver bullion coins rebounded strongly during May.
Sales of the American Gold Eagle bullion coins during April had declined to only 20,000 ounces, the lowest monthly sales since June 2008 when 15,500 ounces were sold.  During May, the U.S. Mint sold 50,000 ounces of gold bullion coins, up 150% from April sales of 20,000 ounces.

The monthly sales figures for bullion coins can vary dramatically for a number of reasons, but support for the increase in demand during May may be due to the recent pullback in gold prices.  During May, the closing London PM Fix Price for gold declined by 6.3% from $1,664 to $1,558 per ounce.  Through the end of May, gold has declined by $40 from $1,598 at the beginning of 2012.  Gold reached a 2012 high of $1,781 on February 28th.

Sales of the American Eagle gold bullion coins hit a record high during the financial turmoil of 2009 as investors eagerly purchased 1,435,000 ounces of gold.  Ironically, sales of gold declined during the next two years despite the fact that the financial system has become more unstable as sovereign governments worldwide continue to borrow and print fiat money on an unprecedented scale in an effort to prop up a world economy burdened by unsustainable debt levels and nonexistent economic growth.  The ongoing simultaneous collapse of the banking systems and economies of the Eurozone is the most obvious trigger for the next phase of the financial crisis.  As confidence in paper money evaporates, expect gold to soar as investors stampede into the only currency that governments cannot debase.

Gold Bullion U.S. Mint Sales By Year
Year Total Sales Oz.
2000 164,500
2001 325,000
2002 315,000
2003 484,500
2004 536,000
2005 449,000
2006 261,000
2007 198,500
2008 860,500
2009 1,435,000
2010 1,220,500
2011 1,000,000
2012 280,500
Total 7,530,000
Note: 2012 totals through May 31, 2012

Sales by the U.S. Mint of the American Silver Eagle bullion coins for May almost doubled from the previous month.  Total sales of  silver bullion coins for May totaled 2,750,000 ounces, up 81% from sales of 1,520,000 ounces in April.  Year to date sales of the American Silver Eagle bullion coins through May 31st came in at 14,409,000, down by 23.8% from the first five months of 2011.  Sales of the silver bullion coins reached all an all time high during 2011.   Since reaching a multi decades high of $48.70 during April of 2011, silver has since corrected, closing out the month of May 2012 at $28.10.

Total annual U.S. Mint sales of the American Silver Eagle bullion coins since 2000 are shown below.  Sales totals for 2012 are through May 31.

In addition to gold and silver bullion coins, the U.S. Mint also sells numismatic versions (uncirculated and proof) of gold and silver American Eagle coins which can be purchased by the public directly from the U.S. Mint.  Gold and silver bullion coins are sold by the U.S. Mint only to authorized purchasers who in turn resell them to the general public and secondary retailers.

American Silver Eagle Bullion Coins
YEAR OUNCES SOLD
2000 9,133,000
2001 8,827,500
2002 10,475,500
2003 9,153,500
2004 9,617,000
2005 8,405,000
2006 10,021,000
2007 9,887,000
2008 19,583,500
2009 28,766,500
2010 34,662,500
2011 39,868,500
2012 14,409,000
TOTAL 212,809,500

Gold and Silver Bullion Coin Sales Rise In March

Production figures from the U.S. Mint for March show a sharp increase in the sale of both gold and silver bullion coins from the previous month.

Total sales of the American Gold Eagle bullion coins increased in March to 62,500 ounces, up from 21,000 ounces in February.  Total sales of the American Silver Eagle bullion coins totaled 2,542,000 ounces in March, up from 1,490,000 ounces in February.  Sales of both bullion coins for the first quarter of 2012, however, declined from the prior year.

Sales of the American Gold Eagle bullion coins totaled 210,500 ounces for the first quarter of 2012, down 29.7% from the 299,500 ounces sold in the first quarter of 2011.  Total sales of the American Silver Eagle bullion coins amounted to 10,139,000 ounces during the first quarter of 2012, down by 18.4% from the 12,429,000 ounces sold in the prior year’s first quarter.

The all time record year for sales of the American Gold Eagle bullion coins occurred in 2009 with 1,435,000 ounces sold.  The all time high record for sales of the American Silver Eagle bullion coins was in 2011 when a total of 39,868,500 one ounce coins were sold.

Gold Bullion U.S. Mint Sales By Year
Year Total Ounces Sold
2000 164,500
2001 325,000
2002 315,000
2003 484,500
2004 536,000
2005 449,000
2006 261,000
2007 198,500
2008 860,500
2009 1,435,000
2010 1,220,500
2011 1,000,000
2012 210,500
Total 7,460,000
Note: 2012 totals through March 31, 2012

The amount of physical gold bullion purchased purchased from the U.S. Mint over the past 12 years remains relatively small compared to the amount of gold invested in the two largest gold trust ETFs.  The SPDR Gold Shares ETF (GLD) is the world’s largest physically backed gold exchange traded ETF fund with current holdings of 41.4 million ounces of gold.  The iShares Gold Trust ETF (IAU) currently holds 6.2 million ounces of gold.

The total sales of gold and silver bullion coins detailed above do not include U.S. Mint gold and silver numismatic coin sales which are directly sold to the public.  American Gold and Silver Eagle bullion coins are only sold to a network of authorized purchasers  who in turn resell the coins to secondary retailers and the public.  The U.S. Mint decided that using  Authorized Purchasers to sell gold and silver bullion coins to the public was the most efficient means of selling the coins to the public at competitive prices.

Shown below are the U.S. Mint sales figures for the American Silver Eagle bullion coins since 2000.  Sales totals for 2012 are through March 31st.

American Silver Eagle Bullion Coins
YEAR OUNCES SOLD
2000 9,133,000
2001 8,827,500
2002 10,475,500
2003 9,153,500
2004 9,617,000
2005 8,405,000
2006 10,021,000
2007 9,887,000
2008 19,583,500
2009 28,766,500
2010 34,662,500
2011 39,868,500
2012 10,139,000
TOTAL 208,539,500

Gold Bullion Coin Sales Soar By 94% In January As Confidence In The Dollar Crumbles

According to the latest production figures from the U.S. Mint, January sales of American Gold Eagle bullion coins soared by 93.8% over the previous month.

A total of 127,000 ounces were sold in January compared to 65,500 ounces in December 2011.  The surge in demand for gold bullion coins is now at the highest level since January 2011 when 133,500 ounces were sold.

Investors are taking opportunity of the bargain price of gold which remains below last year’s high.  After hitting a London PM Fix price of $1,895 on September 6, 2011, gold sold off by 19.2% to a closing low of $1,531.00 on December 29, 2011.

Since the beginning of the year, the price of gold has steadily advanced.  The closing London PM Fix price of $1,744.00 on January 31st represents a gain of $213 per ounce for the month, up 13.9% from the 2011 year end price.  The price of silver has also advanced strongly in 2012 with a gain of 26.8% from last year’s low amid record breaking demand for the American Silver Eagle bullion coins.

Sales of the American Gold Eagle bullion coins hit an all time record in 2009 when 1,435,000 ounces were sold.  A summary of annual gold bullion sales since 2000 is shown below.

Total yearly gold bullion coin sales from January 1, 2000 to January 31, 2012 are shown below.

Gold Bullion U.S. Mint Sales By Year
Year Total Ounces Sold
2000 164,500
2001 325,000
2002 315,000
2003 484,500
2004 536,000
2005 449,000
2006 261,000
2007 198,500
2008 860,500
2009 1,435,000
2010 1,220,500
2011 1,000,000
2012 127,000
7,376,500
Note: 2012 total through January 31, 2012

The huge demand during 2009 for gold bullion coins came in the wake of the 2008 financial system meltdown as investors sought a safe haven from paper assets.  Here we are four years later and the financial system is more fragile than ever with insolvent banks  and governments being propped up by central banks that are printing money on a scale previously unimaginable.

Although I have been a precious metals investor for many years (more sometimes than I care to think about), many of the people I deal with on a personal  and professional level seemed to be totally confident holding only paper assets, even after the financial system came very close to a total collapse in 2008.

That confidence now seems  to be slowly but persistently eroding and I am seeing many people enter the precious metals market for the first time.  It is not an “all in” seismic shift but rather a thoughtful and fundamental portfolio reallocation based on the growing realization that paper dollars are being constantly debased.

A one time bout of money printing by the Federal Reserve to “save the system” can perhaps be quickly forgotten, but a persistent and deliberate effort to debase the currency is another matter.  The growing realization that the Federal Reserve is deliberately destroying the integrity of the dollar will be the basis for continual future demand for the only real money left – gold.

The growing movement to reallocate wealth into gold is still in its infancy which implies a future gold value many thousands of dollars higher than today’s price.

Demand For Silver Bullion Coins Hits Record High On Bargain Prices

Sales of American Silver Eagle bullion coins hit an all time record high during 2011 according to production figures from the U.S. Mint.

Sales of the Silver Eagle bullion coins increased by 13.3% in December to 2,009,000 compared to last year’s sales of 1,772,000.  For all of 2011, total Silver Eagle sales came in at an all time record high of 39,868,500 ounces, up 15.0% from the prior year’s total of 34,662,500 ounces.

In addition to the silver bullion coins, the U.S. Mint also produces proof and uncirculated American Eagle silver coins which can be purchased by the public directly from the U.S. Mint.  Commencing in 2010, the U.S. Mint began producing the America the Beautiful Silver Bullion 5oz coin.  During 2011, the U.S. Mint sold 397,700 of the 5oz coins, which represents almost another 2 million ounces of physical silver demand during 2011.

The U.S. Mint does not sell the American Silver Eagle bullion coins directly to the public.  The bullion coins are purchased from the U.S. Mint by a network of authorized purchasers who in turn resell them to secondary retailers for public sale.

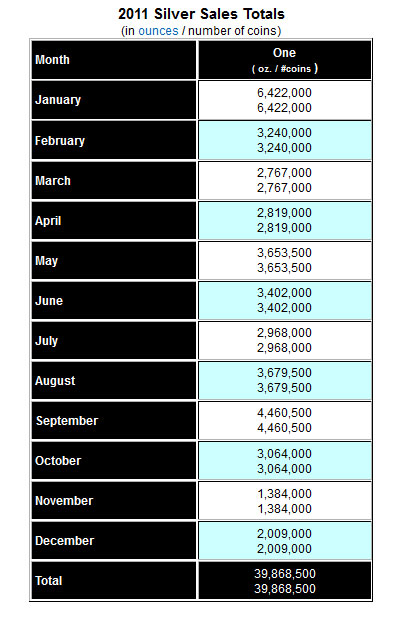
Monthly sales of the Silver Eagle bullion coins during 2011 are shown below.

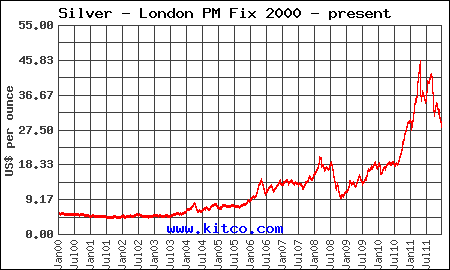
Silver had a volatile year during 2011, reaching a high of $48.70 in April and then dropping to a low of $32.50 in May after the COMEX repeatedly raised margin requirements on silver futures (see How the COMEX Crashed The Silver Market).  After recovering to $43.49 in August, silver declined to end the year at $28.18, off 8.1% for the year.

Despite the volatility in silver prices during 2011, investor demand for physical silver remained exceptionally strong.  After the significant price pullback from the April high, many analysts and armchair commentators who never owned an ounce of silver in their life were predicting a plunge in demand for silver.  The exact opposite occurred as long term investors took advantage of what is another historic buying opportunity comparable to 2008.

The case for buying silver remains rock solid and patient long term investors have been well rewarded.  As opposed to buyers of paper silver products such as the iShares Silver Trust ETF (SLV), holders of physical silver are invested in precious metals as part of a long term wealth preservation and appreciation strategy.  While speculators in paper silver products trade in and out, usually winding up with losses from my observations, long term holders of physical silver have seen the value of their holdings rise significantly.

Silver - courtesy kitco.com

As central banks of the world continue to print money at an accelerated rate, 2012 should be a year of strong gains for both gold and silver.  A steady plan of silver and gold bullion accumulation remains a no-brainer decision.  Since 2008, sales of silver eagle bullion coins have soared.  Last year, extremely heavy demand for silver resulted in periodic product allocations by the U.S. Mint.

In an excellent article by Steve Angelo, it was shown that massive physical demand for both the American Silver Eagles and Canadian Maple Leaf coins resulted in official coin sales surpassing the total silver production of both the United States and Canada.

Expect demand for silver bullion products during 2012 to surpass the record year of 2011.  Shown below are the yearly sales figures since 2000 for the American Silver Eagle bullion coins.

American Silver Eagle Bullion Coins
YEAR OUNCES SOLD
2000 9,133,000
2001 8,827,500
2002 10,475,500
2003 9,153,500
2004 9,617,000
2005 8,405,000
2006 10,021,000
2007 9,887,000
2008 19,583,500
2009 28,766,500
2010 34,662,500
2011 39,868,500


US Mint Gold and Silver Bullion Coin Sales By Month

Through the end of April, the United States Mint has now sold 466,000 ounces of gold and 16,375,000 ounces of silver through its bullion coin programs. In both cases the figures are far ahead of the numbers from the comparable year ago period, despite the higher market price per ounce for the bullion.
Last year through the end of April, US Mint gold bullion sales were 388,000 troy ounces, while the price of gold ranged from a low of $1,058.00 to a high of $1,179.25 per ounce. Silver bullion sales during this period were 11,531,000 with the market price ranging from a low of $15.14 to a high of $18.84 per ounce.

US Mint Gold and Silver Bullion Sales (in ounces)

January February March April Total
American Gold Eagle 133,500 92,500 73,500 108,000 407,500
American Gold Buffalo 38,000 20,500 58,500
Total Gold in ounces 133,500 92,500 111,500 128,500 466,000
American Silver Eagle 6,422,000 3,240,000 2,767,000 2,819,000 15,248,000
ATB Silver 1,127,000 1,127,000
Total Silver in ounces 6,422,000 3,240,000 2,767,000 3,946,000 16,375,000

During the latest month of April 2011, the US Mint recorded sales of 128,500 troy ounces of gold bullion, comprised of 108,000 ounces worth of American Gold Eagles and 20,500 ounces worth of American Gold Buffaloes.

Meanwhile, silver bullion sales for the latest month reached 3,946,000 ounces, the second highest level of the year. For three months running, the pace of sales for the American Silver Eagles had remained approximately the same base level, despite indications of higher demand. The restrained sales are presumably the impact of the US Mint’s allocation program, which rations the available number of bullion coins amongst the authorized purchasers.

The boost in silver bullion sales seen in April was due to the release of the 2011-dated America the Beautiful Silver Bullion Coins. These coins each contain five troy ounces of silver and have a diameter of 3 inches. Sales began on April 25, 2011, and authorized purchasers immediately purchased coins accounting for 1,127,000 troy ounces of silver.

US Mint Silver Bullion Sales Set Monthly Record

The pace of sales for the United States Mint’s American Gold Eagle and American Silver Eagle bullion coins jumped in the past week. This propelled silver bullion sales far into record territory for the month of January.

In the prior week ending February 2, 2011, the US Mint sold 1,748,000 ounces worth of Silver Eagles and 56,500 ounces of Gold Eagles. These are sizable increases from the prior week, when the pace of sales had slowed considerably.

Currently, the US Mint offers only these two options for precious metals investors. The American Gold Buffalo, struck in 24 karat gold, has been unavailable for several months. The American Platinum Eagle remains on indefinite hiatus since late 2008. The recently introduced America the Beautiful Silver Bullion Coins are now in production for the 2011 designs, following the rapid sell out of the previous year’s coins.

US Mint Bullion Coin Program Sales 2/2/2011 (ounces)

Prior Week Month to Date Year to Date
American Silver Eagle 1,748,000 50,000 6,472,000
American Gold Eagle 56,500 6,000 139,500
America the Beautiful Silver 0 0 0
American Platinum Eagle 0 0 0
American Gold Buffalo 0 0 0

For the month of January 2011, Silver Eagle bullion coin sales reached 6,422,000, representing the highest monthly sales total in the history of the program. The previous monthly record of 4,260,000 ounces was set in November 2010, at the time breaking the long standing record of 3,696,000 ounces from December 1986.

To put this monthly sales total into perspective, there were ten separate years of the program where annual sales did not reach this level. If the pace of sales continues for the rest of 2011, more than 77 million ounces of silver would be sold. This amount exceeds the total annual domestic silver mining production of the United States.