 Long term proponents of sound money cannot seem to get enough of U.S. Mint produced gold and silver bullion coins. Ever since the financial crash of 2008 many Americans remain profoundly skeptical of the paper dollar system backed by the “full faith and credit” of a nation that has borrowed itself into poverty and promised more in social benefits than the economy can possible provide.
From 2000 to 2007 sales of the U.S. Mint American Eagle gold bullion coins averaged about 341,000 ounces annually. After the crash of 2008 exposed the risk of paper assets, sales of the gold bullion coins have averaged about 1,011,300 ounces annually from 2008 to 2013.
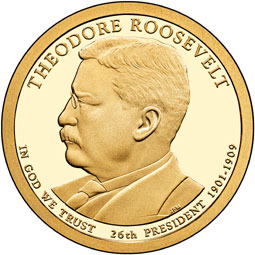
Year to date sales of the American Eagle gold bullion coins as of the end of November totaled 800,500 ounces, surpassing total 2012 sales of 753,000 ounces. For November the U.S. Mint sold 48,000 ounces of gold bullion coins, slightly below the sales figures of 48,500 for the previous month. Since 2000 investors have stashed away 8.8 million gold bullion coins currently worth about $11 billion.

Gold has retained its value throughout human history and strong demand for gold over the ages has resulted in the depletion of most gold deposits on the planet. As noted in a previous post, about 75% of all gold deposits have already been mined which forebodes a future gold shortage.
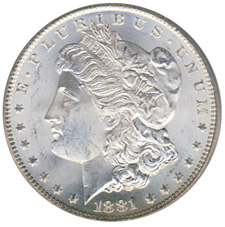
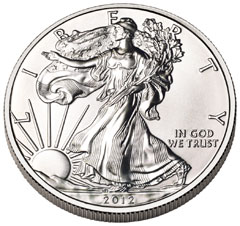
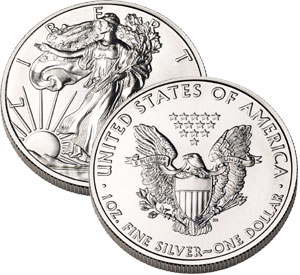 As noted in a previous post, sales of the U.S. Mint American Eagle silver bullion coins hit record annual sales volume in November. The U.S. Mint sold a total of 41,475,000 silver bullion coins as of November 30th, surpassing the previous record sales year of 39,868,500 coins in 2011.
Sales of the American Eagle silver bullion coins for November came in at 2,300,000, a decline of 787,000 coins compared to 3,087,000 in the previous month. The lower sales figures for November do not reflect a drop in demand for silver bullion coins but rather the opposite due to the fact that the U.S. Mint has run out of coins due to unprecedented demand.
This same shortage situation existed last year when the Mint ran out of silver bullion coins in mid December with orders for the new 2013 silver bullion coins not being accepted until January 7, 2013. This situation resulted in a three week period during which the American Eagle silver bullion coins were simply not available.

The period of time during which silver bullion coins will be unavailable from December 2013 to January 2014 will be even longer than last year.
According to coinupdate.com silver bullion coins will not be available for investor purchase for over a month and supplies will be rationed when available.
The United States Mint recently provided authorized purchasers with information on year end ordering procedures and the availability of 2014-dated releases for the American Eagle and American Buffalo bullion programs. Based on the details provided, it seems that the American Silver Eagle bullion coins will experience roughly one month of unavailability between the final allocation of 2013-dated coins and the release of the first 2014-dated coins.
The situation for American Silver Eagle bullion coins differs from the prior year. Authorized purchasers will be offered the last weekly allocation of 2013-dated coins on Monday, December 9, 2013. With demand continuing to run ahead of the available supplies, the allocation will likely be quickly depleted.
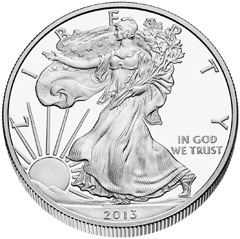
The 2014-dated Silver Eagle bullion coins will not be available to order until Monday, January 13, 2014. The initial release will be subject to the US Mint’s allocation program, which rations supplies amongst the authorized purchasers.
With such a severe shortage of silver bullion coins, expect buyer premiums to increase significantly over the next two months.


 The American public’s love affair with the U.S. Mint American Eagle silver bullion coin continues unabated. Ever since the financial meltdown of 2008 there has been an explosion in demand for the silver coins. Average yearly sales of the silver bullion coins have increased by almost 500% since 2008 and sales for 2013 are on the verge of shattering all previous yearly sales records.
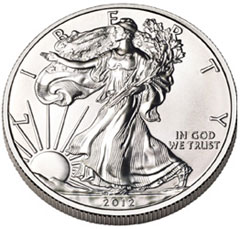
 The American Eagle silver bullion coins cannot be purchased by individuals directly from the U.S Mint. The coins are sold only to the Mint’s network of authorized purchasers who buy the coins in bulk based on the market value of silver and a markup by the U.S. Mint. The authorized purchasers sell the silver coins to coin dealers, other bullion dealers and the public. The Mint’s rationale for using authorized purchasers is that this method makes the coins widely available to the public with reasonable transaction costs.
 The case has been conclusively settled. All those paranoid people who have been claiming manipulation of the silver market are wrong according to the Commodities Futures Trading Commission (CFTC).
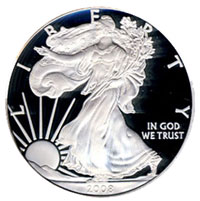 There is no denying that it has been a really tough year for silver investors with silver dropping from $32.23 in January to a yearly low of $18.61 in June. Is the silver price correction finally over? The ridiculously low price of silver has resulted in a strong surge of demand worldwide and the price of silver has soared by 23% since the June low.
 A Fun Look at Silver’s Looong Correction and a Positive Look Ahead
 By: GE Christenson
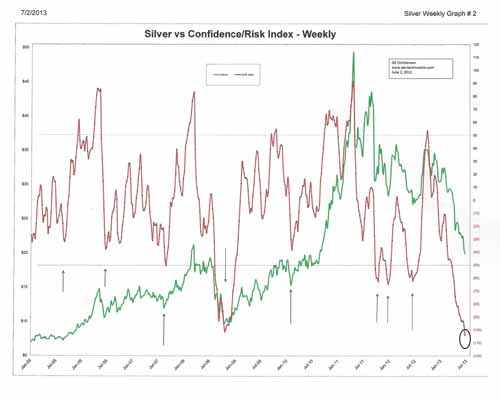
 Precious metals analyst Suki Coper at Barclays takes a look at the silver market in an interview with Bloomberg Television.
 By: GE Christenson
 By: GE Christenson