April 18, 2024

Demand For Silver Tops One Billion Ounces Per Year

Here’s a great infographic from the Visual Capitalist showing the supply and demand statistics for silver.  Interestingly, most of the silver produced each year is consumed in thousands of different industrial applications, leaving a relatively small amount available for investment in coins, bars and jewelry.  Unlike gold, the vast majority of silver produced over the years has been consumed, with much of it lost to landfills, leaving a relatively small above ground supply.


Why Silver Will Hit $100

By GE Christenson

There are many predictions for the price of silver. Some say it will crash to nearly $20, and others proclaim $100 by the end of 2012. The problem is that some predictions are only wishful thinking, others are obvious disinformation designed to scare investors away from silver, and many are not grounded in hard data and clear analysis. Other analysis is excellent, but both the process and analysis are difficult to understand. Is there an objective and rational method to project a future silver price that will make sense to most people?

Yes, there is!

I am not predicting a future price of silver or the date that silver will trade at $100, but I am making a projection based on rational analysis that indicates a likely time period for silver to trade at $100 per ounce. Yes, $100 silver is completely plausible if you assume the following:

  • The US government will continue to spend in excess of $1 Trillion per year more than it collects in revenue, as it has done for the previous four years, and as the government budget projects for many more years.
  • Our financial world continues on its current path of deficit spending, debt monetization, Quantitative Easing (QE), weaker currencies, war and welfare, ballooning debts, and business as usual.
  • A massive and devastating financial and economic melt-down does NOT occur in the next four to six years. If such a melt-down occurs, the price of silver could skyrocket during hyperinflation or stagnate under a deflationary depression scenario.

Still with me? I think most people will accept these simple and rather obvious assumptions.

Many individuals find it difficult to believe any projections for silver, either higher or lower, because silver is hated, loved, often ignored, and seldom recognized as another currency. However, most people know that the US government national debt is huge and will grow much larger during the next decade. Examine the following graph:

Click on image to enlarge.

National debt is plotted on the left axis – yes, it was larger than $16 Trillion as of September 30, 2012. Silver is plotted on the right axis. The data covers an 11 year span from September 2001 through September 2012. This period includes the time after the stock market crash of 2000, the game-changing events of 9-11, the real estate crash, and the new bull market in commodities. Each month represents one data point. Note the similarity between the two trends. The statistical measure R-Squared for this 11 year period of monthly data is 0.838 – quite high. R-Squared increases to about 0.90 if national debt is correlated to the monthly price of silver after it has been smoothed with 9 month moving average.

This expansion in the national debt is a simple proxy for expansion of the money supply and the devaluation of the dollar. The exponential growth rate for the national debt averaged over this period is 9.7% compounded annually, while the rate averaged over the last five years is 12.3%. The exponential growth rate for silver is a bit larger – about 20% per year compounded annually. I attribute this larger rate, in excess of 12.3%, to the realization that silver is a competing currency, mining supply is growing slowly, most governments are aggressively “printing money,” industrial demand is increasing, and some investors are actively buying silver. In short, demand is increasing while the realization that silver is still an undervalued investment and cannot be “printed” at will (like dollars and euros) has reached the awareness of individual investors. I believe it is very likely that national debt and the price of silver will continue their 11 year exponential growth trend.

Since silver correlates relatively closely with national debt, we can use national debt as a clear, objective, and believable proxy to model the future price of silver. Extend national debt and silver prices forward for the next six years based on the exponential increase from the last five years, and the result is the following table. Bracket silver prices, high and low, based on past annual volatility of roughly +60% and -35%. You can see from the graph that silver prices are very erratic – silver rallies too far and too fast, and then crashes to absurdly low levels. These stunning rallies and crashes have happened for at least 35 years and probably will continue throughout this decade.

Whether or not prices and crashes are manipulated, and there seems to be credible evidence to indicate such, the “big picture” view is that silver has rallied from about $4 to nearly $50, crashed back to about $25, and is set to rally to well over $100 in the next few years. The week to week movements will become even more extreme so focus on the long-term trend to reduce anxiety and fear.

As you can see, this projection for silver prices indicates that silver could reach $100 as soon as late 2015, with a theoretical projected price of $100 about 2017. The price of silver is about $32.00 as of November 1, 2012.

The next graph shows the price of silver, on a logarithmic scale, with high and low trend lines. The horizontal line at $100 shows the earliest and latest dates at which the trend lines project silver will reach that price. Those dates are 2015 through late 2017, which are consistent with the above projection based on the tight correlation to the national debt. The important realization is that $100 silver is just a matter of time – say three to five more years – depending on the level of QE “money printing,” inflationary expectations, dollar devaluations, fiscal insanity, government deficit spending, wars, and welfare. We have been warned!

Conclusion

We may be skeptical of price projections for silver, but projections for national debt are quite believable. Since the correlation is very close, future silver prices can be projected, assuming continuing deficit spending, QE, and other macroeconomic influences. A dollar crash or an unexpected bout of congressional fiscal responsibility could accelerate or delay the date silver trades at $100, but the projection is reasonable and sensible. Silver increased from $4.01 (November 2001) to over $48 (April 2011). A silver price of $48 seemed nearly impossible in 2001, yet it happened. An increase from about $32 (October 2012) to $100 (perhaps in 2015 – 2016) seems much easier to believe, especially after Bernanke’s recent announcement of QE4-Ever. Read We Have Been Warned.

“Inflation is as violent as a mugger, as frightening as an armed robber and as deadly as a hit man.” – Ronald Reagan

GE Christenson
aka Deviant Investor

The History Of Silver

Silver has been regarded as a store of value and used as a currency for more than 4,000 years.  The role of silver as a form of wealth preservation in a diversified portfolio is likely to grow as central banks suppress real interest rates to below zero while conducting large scale money printing operations.

Investors who harbor major doubts about the integrity of fiat currencies should continue to invest regularly.  Despite being more volatile than gold, until governments regain control of massive fiscal deficits and central banks return to sound money policies, long term silver investment is a sound strategy.

The latest infographic from the Visual Capitalist provides a nice visual history of silver (please click on the image to enlarge).

U.S. Mint Numismatic Precious Metals Sales Decline

According to Coin Update, sales of numismatic precious metal coins showed weekly sales declines.  Future sales, however, may increase due to an upcoming price decrease based on the recent correction in precious metal prices.

The latest report of the United States Mint’s numismatic product sales shows mostly lower numbers for precious metals products. Elsewhere in the report, the Chester Arthur Presidential $1 Coin and Alice Paul Bronze Medal Set makes its debut.

Ten out of sixteen gold numismatic products showed weekly sales declines compared to the prior period. The US Mint currently has these products priced based on an average gold price within the $1750 to $1799.99 range. With the market price of gold below this range for the entire reporting period, buyers may be showing restraint as they await the next weekly pricing adjustment.

Eighteen out of twenty-seven of the silver numismatic products showed weekly sales declines compared to the prior period. The US Mint raised prices for many of these products earlier in the month when the market price of silver was approaching $35 per ounce. Silver has since fallen back from this level, although the higher product prices remain in effect. The America the Beautiful Five Ounce Silver Coins showed sales declines across all nine options currently available. Gains were seen for the 2012 Proof and 2012-W Uncirculated Silver Eagles compared to the prior period.

The 2012 Proof Platinum Eagle, which is the only available platinum product, showed negative sales on the week.

See the full sales report for U.S. Mint numismatic products here.

Month to date figures for U.S. Mint gold and silver bullion coins remains strong.  Through October 24th, the U.S. Mint sold 2,584,000 one ounce American Eagle Silver Bullion coins.  If the current sales pace continues, monthly sales could exceed 3.5 million ounces which would be the second best monthly sales total after January when 6,107,000 silver Eagles were sold.

Sales of the American Eagle Gold Bullion coins also remain strong through October 24th with 48,500 ounces sold.  If the current pace of sales is maintained, total sales of the American Gold Bullion coins should reach almost 65,000 for October which would be the third highest sales month of the year.  In January the U.S. Mint sold 127,000 ounces of gold bullion coins followed by 68,500 ounces in September.

Although gold prices have soared over the past decade and the purchasing power of the dollar has collapsed, the American public still does not recognize the value of gold and silver as a store of wealth.  Expect this to change as the bull market in precious metals continues.

Gold Bullion Coin Sales Soar 76% In September, Silver Sales Up 13%

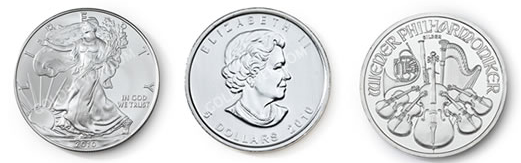
According to the latest report from the U.S. Mint, demand for both gold and silver bullion coins during September surged to the highest levels since January.

Total sales of the American Eagle Gold bullion coins during September soared 75.6% to 68,500 ounces from 39,000 ounces in August.  Monthly sales of gold bullion coins have fluctuated widely during 2012 with a high of 127,000 ounces in January and a low of 20,000 ounces in April.   The average monthly sales of gold bullion coins through September is 53,500.

Total sales of the American Eagle Gold bullion coins through September total 481,500 ounces.   Unless sales surge dramatically during the last three months of the year, 2012 will be the fourth year of declining sales of the gold bullion coin.   As detailed below, the all time record for sales of the gold bullion coins was during 2009 when sales exceeded 1.4 million ounces.

Gold Bullion U.S. Mint Sales By Year
Year Total Sales Oz.
2000 164,500
2001 325,000
2002 315,000
2003 484,500
2004 536,000
2005 449,000
2006 261,000
2007 198,500
2008 860,500
2009 1,435,000
2010 1,220,500
2011 1,000,000
Sept-12 481,500
Total 7,731,000

U.S. Mint sales of the American Eagle Silver bullion coins during September totaled 3,255,000 ounces, up 13.4% from August sales of 2,870,000 ounces.

Investor demand for the American Eagle Silver bullion coins has been relatively consistent throughout the year.  After a very strong January during which over 6.1 million coins were sold, demand remained strong with monthly sales well in excess of 2 million ounces except for February when sales slumped to 1,490,000 ounces.  If monthly sales of the American Eagle silver coins continue at the September sales pace, total sales for 2012 will be close to the record year of 2011 when almost 40 million ounces were sold.

Total annual sales by the U.S. Mint of the silver bullion coins since 2000 are shown below.  Sales for 2012 are through September.

American Silver Eagle Bullion Coins
YEAR OUNCES SOLD
2000 9,133,000
2001 8,827,500
2002 10,475,500
2003 9,153,500
2004 9,617,000
2005 8,405,000
2006 10,021,000
2007 9,887,000
2008 19,583,500
2009 28,766,500
2010 34,662,500
2011 39,868,500
Sept-12 25,795,000
TOTAL 224,195,500

The American Eagle gold and silver bullion coins produced by the U.S. Mint can only be purchased by Authorized Purchasers who in turn resell the coins to other dealers and the general public.  Numismatic versions (uncirculated or proof) of the American Eagle series coins can be purchased by the public directly from the U.S. Mint.

Gold and Silver Bullion Coin Sales Jump 25% In August, San Francisco Silver Eagle Set Sold Out

The latest sales figures from the U.S. Mint for August show a significant increase in sales of both gold and silver bullion coins.

Sales of gold bullion coins during 2012 have varied dramatically from month to month with a high of 127,000 ounces in January to a low of only 20,000 ounces in April.  Monthly gold bullion sales through August have averaged 51,625 ounces.

Monthly sales of silver bullion coins have been more consistent during 2012.  The U.S. Mint sold over 6 million ounces of silver bullion coins in January, but the monthly pace has tapered off to under 3 million ounces.  The average monthly sales of silver bullion coins through August is 2,817,500.

American Eagle Gold Bullion Coin Sales

Total sales of the American Eagle Gold bullion coins during August totaled 39,000 ounces, up 27.9% from July’s total of 30,500 ounces.  Total sales of gold bullion coins by the U.S. Mint through August totaled 413,000 ounces, valued at approximately $700 million based on today’s closing gold price.

On an annualized basis, the U.S. Mint will sell almost 620,000 ounces of  gold bullion to investors this year valued at $1.0 billion if the price of gold remains at $1,692.  During 2009, the peak year of gold bullion coin sales by the U.S. Mint, investors purchased 1,435,000 ounces valued at $1.4 billion based on the average price of gold of $972 per ounce.

Investors who have reduced gold bullion purchases due to the increased cost per ounce will no doubt regret this decision as the price of gold continues to increase.  The value of gold should be viewed in the context of the reduced purchasing power of the dollar – as the Federal Reserve constantly destroys the purchasing power of the U.S. dollar, the “dollar cost” of gold will naturally increase.  The price of gold is merely reflecting the fact that paper dollars are worth less and less every day.

As the Fed continues to do what it does, expect the bull market in gold to continue.

Listed below are yearly sales figures for the American Eagle gold bullion coins since 2000.  Sales for 2012 are through August 31st.

Gold Bullion U.S. Mint Sales By Year
Year Total Sales Oz.
2000 164,500
2001 325,000
2002 315,000
2003 484,500
2004 536,000
2005 449,000
2006 261,000
2007 198,500
2008 860,500
2009 1,435,000
2010 1,220,500
2011 1,000,000
2012 413,000
Total 7,662,500

American Eagle Silver Bullion Coin Sales

Sales of the American Eagle Silver bullion coins by the U.S. Mint during August totaled 2,870,000 ounces, up 25% from the July total of 2,278,000 ounces.  Investor demand for silver has remained strong, with many investors taking the opportunity to purchase additional silver below the highs reached during 2011.  Sales of the silver bullion coins remain near record levels and total sales for 2012 should be well in excess of 30 million ounces for the third consecutive year.

Total annual sales by the U.S. Mint of the silver bullion coins since 2000 are shown below.  Sales for 2012 are through August.

American Silver Eagle Bullion Coins
YEAR OUNCES SOLD
2000 9,133,000
2001 8,827,500
2002 10,475,500
2003 9,153,500
2004 9,617,000
2005 8,405,000
2006 10,021,000
2007 9,887,000
2008 19,583,500
2009 28,766,500
2010 34,662,500
2011 39,868,500
Jul-12 22,540,000
TOTAL 220,940,500

U.S. Mint Numismatic American Eagle Gold and Silver Coins

Both the American Eagle gold and silver bullion coins can only be purchased from the U.S. Mint by Authorized Purchasers who in turn resell the coins to other dealers and the general public.  The numismatic versions of the American Eagle series coins can be purchased directly from the U.S. Mint.

Many of the numismatic silver coins produced by the U.S. Mint attract strong demand and often times, the coins will sell at a premium in the secondary market.  A recent example of this is the 2012 San Francisco Silver Eagle Set.  According to the Mint News Blog:

The 2012 San Francisco Silver Eagle Set was one of the United States Mint’s most anticipated product releases of the year. Each set contained one 2012-S Proof Silver Eagle and one 2012-S Reverse Proof Silver Eagle.

Product sales began on June 7, 2012 at 12:00 Noon ET with pricing of $149.95 per set. Rather than establishing a maximum product limit, as had been done for similar products in the past, the US Mint would accept orders during a four week ordering window and produce the sets to meet the total demand. A sales odometer which was updated daily gave collectors an indication of the progress of the offering. Sales officially closed on July 5, 2012 at 5:00 PM ET. The last indicated sales total was 251,302 sets.

On the secondary market, prices for the sets remain above the issue price. A quick survey of eBay auctions completed within the past few days show the prices realized for raw sets mostly falling into a range of $180 to $190, compared to the issue price of $149.95.

Sets which have been graded by PCGS or NGC and received the top grade of Proof-70 have sold for premiums above raw sets. Sets with the two coins graded PCGS PR70DCAM and PR70 have recently sold for prices around $425 to $450. Sets with the two coins graded NGC PF 70 Ultra Cameo and PF 70 have sold for prices around $300 to $325.

Gold Bullion Coin Sales Plunge 50% In July, Silver Sales Off 20%

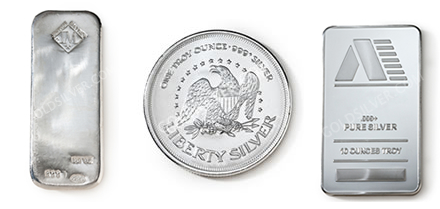
The latest sales figures from the U.S. Mint show that sales of both gold and silver bullion coins declined dramatically during July.  While sales of silver bullion coins have remained at historically high levels, sales of the gold bullion coins have been in a steep decline since 2009.

American Eagle Gold Bullion Coin Sales

Sales of the American Eagle Gold Bullion coins during July totaled 30,500 ounces, a 49.2% decline from June sales of 60,000 ounces.  Two previous months of the year had lower gold coin sales than July.  During February 21,000 ounces of gold bullion coins were sold and in April only 20,000 ounces were sold.   The year to date average monthly sales figures for gold bullion coins total 53,428 compared to a monthly average of 83,333 during 2011.

The all time yearly sales record for the American Eagle gold bullion coins was set during 2009 when it looked as if the entire U.S. banking system was about to collapse.  Sales in each subsequent year have been lower than 2009 despite the increase in the price of gold since then.  In 2009 gold closed the year at $1,087.50 per ounce, subsequently hit a high of $1,895 on September 5, 2011 and closed today at $1,615.90 in New York trading.  If sales during 2012 are annualized, total gold bullion coin sales will reach approximately 641,000 ounces, the lowest amount since 2007 when yearly sales came in at 198,500 ounces.

Listed below are yearly sales figures for the American Eagle gold bullion coins since 2000.  Sales for 2012 are through July 31st.

Gold Bullion U.S. Mint Sales By Year
Year Total Sales Oz.
2000 164,500
2001 325,000
2002 315,000
2003 484,500
2004 536,000
2005 449,000
2006 261,000
2007 198,500
2008 860,500
2009 1,435,000
2010 1,220,500
2011 1,000,000
2012 374,000
Total 7,623,500

The graph below shows gold bullion coins sales since 2012, with sales annualized for 2012.

American Eagle Silver Bullion Coin Sales

According to the U.S. Mint, sales of the American Eagle silver bullion coins totaled 2,278,000 ounces during July, a decline of 20.3% from June’s total of 2,858,000.   The highest monthly sales of the silver bullion coins during 2012 was 6,107,000 ounces recorded in January followed by the lowest monthly sales of 1,490,000 ounces in February.  Average monthly sales of the silver bullion coins through July was 2,810,000.

The silver bullion coins have showed resilient demand despite the drop in silver prices since mid 2011.  Based on year to date sales figures, total sales of the silver bullion coins could approach 34 million ounces, not far below the record sales figure recorded in 2011 when almost 40 million ounces were sold.

Total annual sales by the U.S. Mint of the silver bullion coins since 2000 are shown below.  Sales for 2012 are year to date totals through July.

American Silver Eagle Bullion Coins
YEAR OUNCES SOLD
2000 9,133,000
2001 8,827,500
2002 10,475,500
2003 9,153,500
2004 9,617,000
2005 8,405,000
2006 10,021,000
2007 9,887,000
2008 19,583,500
2009 28,766,500
2010 34,662,500
2011 39,868,500
Jul-12 19,670,000
TOTAL 218,070,500

The American Eagle gold and silver bullion coins are sold by the U.S. Mint only to Authorized Purchasers who in turn resell the coins to the general public and other dealers.  Numismatic versions of the American Eagle series gold and silver coins can be purchased by the public directly from the U.S. Mint.

Gold Bullion Coin Sales Up 13% In June, Silver Bullion Coin Sales Remain Steady

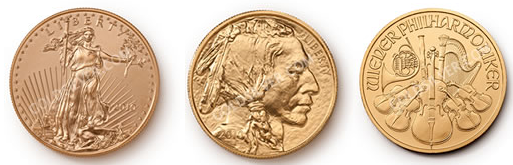
According to the latest report from the U.S. Mint, sales of gold bullion coins increased by over 13% during June, while total sales of the silver bullion coins were essentially unchanged from May.

Monthly sales of the American Eagle gold bullion coin have fluctuated considerably during 2012 with sales reaching a monthly high of 127,000 ounces in January and a monthly low of 20,000 ounces in April.  Sales rebounded strongly in May to 53,000 ounces and continued higher in June with the sale of 60,000 ounces.

Sales of the American Eagle gold bullion coin can vary dramatically from month to month based on many factors.  The all time yearly sales record for the gold bullion coins of 1,435,000 ounces was reached in 2009  when many people feared that the financial system would collapse.  Sales volume of the gold bullion coins have not, however, had a direct correlation to the price of gold.  Gold closed 2009 at $1,087.50 per ounce and subsequently went on to hit a 2011 high of $1,895 on September 5th.  Despite the fact that gold increased by over 74% since year end 2009, total gold bullion coin sales declined in both 2010 and 2011.

If the European financial storm continues to unwind into a collapse similar to what we experienced in 2008, sales of the gold bullion coins could easily expand dramatically over the record levels seen in 2009.  With each passing day, there seem to be fewer reasons to maintain confidence in the paper money system as central bankers and governments attempt to prop up a debt burdened world economy with additional debt and money printing.

Listed below are the yearly sales of the American Eagle gold bullion coins since 2000.  The total for 2012 is through June 30th.

Gold Bullion U.S. Mint Sales By Year
Year Total Sales Oz.
2000 164,500
2001 325,000
2002 315,000
2003 484,500
2004 536,000
2005 449,000
2006 261,000
2007 198,500
2008 860,500
2009 1,435,000
2010 1,220,500
2011 1,000,000
2012 343,500
Total 7,593,000

If the sales trend of American gold bullion coins continues on the pace it has been on thus far, 2012 may turn out to be the fourth year in a row of lower sales.  The graph below shows gold bullion coin sales since 2000 with figures for 2012 annualized based on sales through June 30th.

U.S. Mint sales of the American Eagle silver bullion coin continued strong in June at 2,858,000 ounces, down slightly from the May total of 2,875,000 ounces.  After a strong start in January with sales of over 6 million ounces, sales dipped below 2 million ounces in February and April.  Year to date sales through June 2012 of the silver bullion coins total 17,392,000 ounces, down by 22% from the comparable sales period in 2011 when 22,303,500 ounces were sold.

If sales of the silver bullion coins continue at the same pace for the remainder of 2012, total sales could exceed 34 million ounces, not far below the record set during 2011 of 39.9 million ounces.   Considering that silver has corrected in price from $48.70 reached during April of 2011, the volume of silver bullion coin sales is very robust, with buyers taking advantage of lower prices.

In addition to gold and silver bullion coins, the U.S. Mint sells numismatic series of both gold and silver American Eagle coins which the public can purchase directly from the U.S. Mint.  Bullion versions of the gold and silver American Eagles are only sold to Authorized Purchasers who in turn resell the product to the general public and other dealers.

Total annual U.S. Mint sales of the American Silver Eagle bullion coins since 2000 are shown below.  Sales totals for 2012 are through June 30th.

American Silver Eagle Bullion Coins
YEAR OUNCES SOLD
2000 9,133,000
2001 8,827,500
2002 10,475,500
2003 9,153,500
2004 9,617,000
2005 8,405,000
2006 10,021,000
2007 9,887,000
2008 19,583,500
2009 28,766,500
2010 34,662,500
2011 39,868,500
2012 17,392,000
TOTAL 215,792,500

Gold and Silver Bullion Coin Sales Rebound Strongly In May

According to the latest report from the U.S. Mint, sales of both gold and silver bullion coins rebounded strongly during May.

Sales of the American Gold Eagle bullion coins during April had declined to only 20,000 ounces, the lowest monthly sales since June 2008 when 15,500 ounces were sold.  During May, the U.S. Mint sold 50,000 ounces of gold bullion coins, up 150% from April sales of 20,000 ounces.

The monthly sales figures for bullion coins can vary dramatically for a number of reasons, but support for the increase in demand during May may be due to the recent pullback in gold prices.  During May, the closing London PM Fix Price for gold declined by 6.3% from $1,664 to $1,558 per ounce.  Through the end of May, gold has declined by $40 from $1,598 at the beginning of 2012.  Gold reached a 2012 high of $1,781 on February 28th.

Sales of the American Eagle gold bullion coins hit a record high during the financial turmoil of 2009 as investors eagerly purchased 1,435,000 ounces of gold.  Ironically, sales of gold declined during the next two years despite the fact that the financial system has become more unstable as sovereign governments worldwide continue to borrow and print fiat money on an unprecedented scale in an effort to prop up a world economy burdened by unsustainable debt levels and nonexistent economic growth.  The ongoing simultaneous collapse of the banking systems and economies of the Eurozone is the most obvious trigger for the next phase of the financial crisis.  As confidence in paper money evaporates, expect gold to soar as investors stampede into the only currency that governments cannot debase.

Gold Bullion U.S. Mint Sales By Year
Year Total Sales Oz.
2000 164,500
2001 325,000
2002 315,000
2003 484,500
2004 536,000
2005 449,000
2006 261,000
2007 198,500
2008 860,500
2009 1,435,000
2010 1,220,500
2011 1,000,000
2012 280,500
Total 7,530,000
Note: 2012 totals through May 31, 2012

Sales by the U.S. Mint of the American Silver Eagle bullion coins for May almost doubled from the previous month.  Total sales of  silver bullion coins for May totaled 2,750,000 ounces, up 81% from sales of 1,520,000 ounces in April.  Year to date sales of the American Silver Eagle bullion coins through May 31st came in at 14,409,000, down by 23.8% from the first five months of 2011.  Sales of the silver bullion coins reached all an all time high during 2011.   Since reaching a multi decades high of $48.70 during April of 2011, silver has since corrected, closing out the month of May 2012 at $28.10.

Total annual U.S. Mint sales of the American Silver Eagle bullion coins since 2000 are shown below.  Sales totals for 2012 are through May 31.

In addition to gold and silver bullion coins, the U.S. Mint also sells numismatic versions (uncirculated and proof) of gold and silver American Eagle coins which can be purchased by the public directly from the U.S. Mint.  Gold and silver bullion coins are sold by the U.S. Mint only to authorized purchasers who in turn resell them to the general public and secondary retailers.

American Silver Eagle Bullion Coins
YEAR OUNCES SOLD
2000 9,133,000
2001 8,827,500
2002 10,475,500
2003 9,153,500
2004 9,617,000
2005 8,405,000
2006 10,021,000
2007 9,887,000
2008 19,583,500
2009 28,766,500
2010 34,662,500
2011 39,868,500
2012 14,409,000
TOTAL 212,809,500

Are Gold And Silver Bullion Sales Reported To The IRS? Tips For Keeping Bullion Sales Private

Long term gold and silver investors who have gradually accumulated physical precious metals over the years have seen the value of their holdings increase substantially when measured against the value of the paper dollar.   Astute investors realize that a large part of the “gains” on their precious metals have merely preserved purchasing power compared to paper money which has been consistently debased by the monetary and fiscal policies of the government and federal reserve.

In the eyes of the taxing authorities, however, the increased value of an investment due to inflation is still considered a gain regardless of whether or not there was an increase in purchasing power.  As the chart below graphically depicts, a $4,000 investment made in 1986 and now worth $8,000 is still worth only $4,000 in purchasing power -thus the true economic gain is zero.  Try telling that to the IRS!  After paying long term capital gains on the phantom $4,000 “profit”, you are left with less that you had in 1986.

There is, however, a silver and gold lining for investors in physical precious metals since, under many circumstances, the sale of your gold and silver bullion is not reported to the IRS.  There are circumstances, however, in which a bullion dealer is required to file a Form 1099-B with the IRS which reports sales transaction proceeds, name, address and social security number.  It is obviously important to most investors to know what types of sales are kept private and what types of sales are reported to the IRS.

Thanks to our friends at GoldSilver.com, here is the essential up to date information that you need to know before selling gold and silver bullion.

Before we begin, the following information covers aspects of investor privacy, not an investor’s responsibility to pay income tax gains on any profits made from the purchase and sale of investment grade bullion products.  For tax questions, please seek professional tax consul.

We know investor privacy is very important to physical silver and gold purchasers and confidentiality is one of the values we covet most along with our customers.

For some bullion investors, ensuring themselves a private sale is their most important objective and we understand the myriad of reasons as to why this is so.

That being said, we must always adhere to the rules of our industry.

Being a bullion dealer, we are often asked by customers questions like…

– Are my transactions private?

– When I sell my gold bullion or silver bullion, is it a private transaction, or is it reported to the IRS?


First, when a customer buys from our dealership, the transaction is private.

We have specifically designated the current payment method options on our website so that investors who buy bullion from us, do so in confidentiality.

Secondly, when an investor sells their gold bullion or silver bullion to a dealer like us, some of these trades are private while some are not.

Depending upon what you are selling will depend upon whether the powers that be require us as a bullion dealer to fill out something called an IRS 1099-B Form.


IRS 1099 Gold Reporting & Silver Reporting

When you sell your bullion back to a dealer, the pertinent questions for a dealer are:

1) What form of gold and or silver bullion are you selling?

2) What amount of silver bullion and or gold bullion are you selling?


The following covers private investor sales of bullion products we currently offer at GoldSilver.com.

1099 EXEMPT PRIVATE SILVER BULLION

Private silver bullion ( IRS 1099 Form exempt ) consists of any quantity sold to a dealer of the following items:

– American Silver Eagle Coins

– Canadian Maple Leaf Silver Coins

– Austrian Philharmonic Silver Coins


1099 REQUIRED SILVER BULLION

Reported silver bullion ( IRS 1099 Form required ) consists of 1000 ounces or more sold to a dealer of the following items:

– .999 fine silver bullion bars  (any sizes)

– .999 fine silver bullion rounds  (any sizes)


1099 EXEMPT PRIVATE GOLD BULLION

Private gold bullion ( IRS 1099 Form exempt ) consists of any quantity sold to a dealer of the following items:

– American Gold Eagle Coins

– American Gold Buffalo Coins

– Gold Austrian Philharmonic Coins


1099 REQUIRED GOLD BULLION COINS

Reported gold bullion coins ( IRS 1099 Form required ) consists of 25 ounces or more sold to a dealer of the following items:

– Canadian Gold Maples (1 oz)

– South African Krugerrands (1 oz)


1099 REQUIRED GOLD BULLION BARS

Reported gold bullion bars ( IRS 1099 Form required ) consists of 32.15 ounces or more sold to a dealer of the following items:

– .999 fine gold bullion bars (any sizes)

***

These are the IRS 1099-B Form reporting requirements for the bullion products we offer at GoldSilver.com as of May 2012.

Stay tuned to GoldSilver.com for any future news or proposed changes to the current IRS 1099 gold and silver reporting requirements.