 Sales of bullion coins by the U.S. Mint were mixed in February with silver bullion coins showing an increase and gold bullion coins a decline.
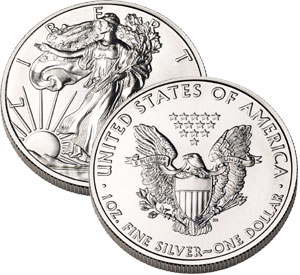
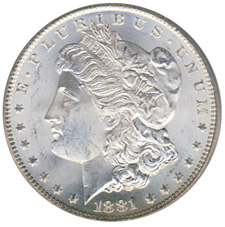
After hitting all time record sales in 2013 sales of the American Silver Eagle bullion coins are off to a slower sales pace in 2014. According to the U.S. Mint a total of 3,750,000 silver bullion coins were sold in February, up by 381,500 ounces or 11.3% over the comparable prior year period. February 2014 year to date sales of silver bullion coins total 8,525,000 ounces, down by 2,341,500 ounces or 21.5% from the previous year.
Retail investors have long regarded silver bullion coins as an excellent investment. The price pullback in silver since 2011 provided an excellent opportunity to make additional purchases at bargain prices and investor took advantage of the situation. Silver bullion coin demand soared last year to almost 42 million ounces and the U.S. Mint could not keep up with demand. Demand for silver coin was so great that the U.S. Mint ran out of coins and suspended sales for most of December and part of January 2014.
Sales of silver bullion coins are shown below by year. The sales for 2014 are through February 28th. Sales of silver bullion coins have exploded since the financial meltdown of 2008 when the Federal Reserve began printing trillions of dollars out of thin air, a program which continues to this day.

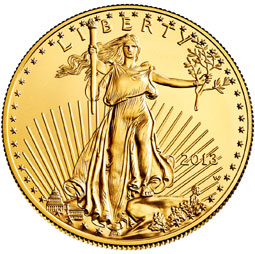
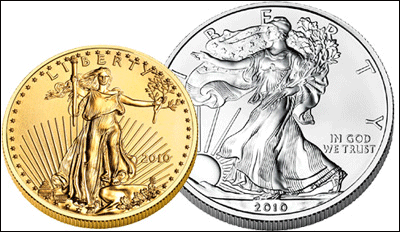
Sales of the American Eagle gold bullion coins slowed dramatically in February compared to last year. Total sales of gold bullion coins was 31,000 ounces compared to 80,500 last February. 2014 year to date sales through February totaled 122,500 ounces compared to 230,500 ounces for the comparable prior year period.
Gold coin sales can fluctuate considerably from month to month but sales have exploded since the financial crisis in 2008 and remain very high by historical standards. After declining for three years in a row, sales of gold bullion coins strengthened during 2013 with sales above 2012 levels.

2014 totals through February 28th.
According to Reuters the decline in gold bullion coin demand was due to large sales of coins by hedge fund speculators and other large investors. As the sale of these coins flooded into dealer vaults they had less need to purchase coin from the U.S. Mint.
The American Eagle silver bullion coins cannot be purchased by individuals directly from the U.S Mint. The coins are sold only to the Mint’s network of authorized purchasers who buy the coins in bulk based on the market value of silver and a markup by the U.S. Mint. The authorized purchasers sell the silver coins to coin dealers, other bullion dealers and the public. The Mint’s rationale for using authorized purchasers is that this method makes the coins widely available to the public with reasonable transaction costs.
| U.S. MINT BULLION COIN SALES | ||||
| MONTH | GOLD | SILVER | ||
| 2014 | 2013 | 2014 | 2013 | |
| JANUARY | 91,500 | 150,000 | 4,775,000 | 7,498,000 |
| FEBRUARY | 31,000 | 80,500 | 3,750,000 | 3,368,500 |
| TOTALS | 122,500 | 230,500 | 8,525,000 | 10,866,500 |
With economic and political turmoil spreading across the globe and central banks standing ready to flood the world with paper currencies, gold and silver continue to remain a safe haven for many investors. It would not be surprising to see gold and silver surge in price this year in defiance of the bearish calls of many analysts.


 By: GE Christenson


 Demand for American Eagle gold and silver bullion coins remained sluggish in September according to the latest figures from the U.S. Mint.

 There is no denying that it has been a really tough year for silver investors with silver dropping from $32.23 in January to a yearly low of $18.61 in June. Is the silver price correction finally over? The ridiculously low price of silver has resulted in a strong surge of demand worldwide and the price of silver has soared by 23% since the June low.
 By:
By:  By: GE Christenson
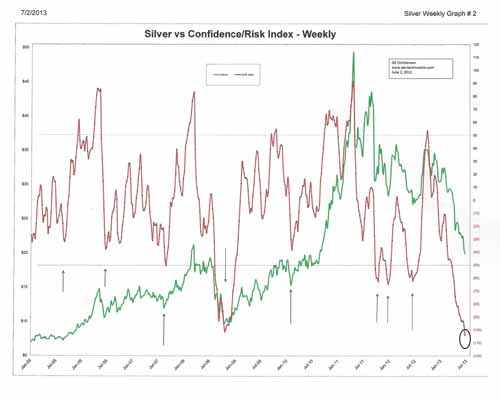
 By: GE Christenson
 By: GE Christenson