April 23, 2024

Collapse of Bernanke’s Credit Bubble Will Destroy the Global Financial System

collapseBy: GE Christenson

The U.S. stock market is near all-time highs, while politicians and economists are blathering about recovery, low inflation, and good times, but instability and danger are clearly visible in our debt based monetary system. To the extent we rely upon the fantasies of ever-increasing debt, money printing, and credit bubbles, we are vulnerable to financial collapses. Perhaps a collapse is not imminent, but it would be foolish to ignore the possibility. Consider what these insightful writers have to say:

The Fantasy of Printing Money To Solve Problems

Bill Fleckenstein:

“Money-printing cannot solve problems. It doesn’t really give us much gross domestic product growth, as we have seen. It hasn’t really helped on the employment front either, as job growth is meager (of course, it is also hampered by other government policies). What money-printing has accomplished is to push the stock market high enough to cause people to once again become delusional in their expectations.”

Egon von Greyerz:

“Debt worldwide is now expanding exponentially. With absolutely no possibility of stopping this debt explosion, we will soon enter a period of unlimited money printing leading to a total destruction of paper currencies. The consequence will be a hyperinflationary depression in most major economies.”

Andy Hoffman:

“No, Larry Summers won’t be able to save the day… The damage is already done; and thus, NOTHING can turn the tide of 42 years of unfettered, global MONEY PRINTING – which as I write, has entered its final, terminal phase.”

Bullion Bulls Canada:

“So the ending is already clear. The U.S.S. Titanic is about to be intentionally sunk (again), and B.S. Bernanke’s ‘fingerprints’ will be planted all over the crime scene.”

CREDIT BUBBLE IN THE GLOBAL ECONOMY WILL EVENTUALLY COLLAPSE

John Rubino:

“…nothing was fixed after 2008, just as nothing was fixed after the housing, tech stock, and junk bond bubbles burst. The response has been the same each time, only progressively more aggressive and experimental. That the financial, economic and political mainstream think that the system has been reset to ‘normal’ because asset prices are back where they were just before the 2008 crash is, well, crazy. With financial imbalances bigger than ever before – and continuing to expand – the only possible outcome is an even bigger crash.”

Bill Holter:

“THIS is where THE REAL BUBBLE is! The biggest bubble in all of history, (larger than the Tulip mania, South Sea, the Mississippi Bubble, 1929, current global real estate and global stock bubble combined then cubed) is the current and total global financial system. EVERYTHING EVERYWHERE is based on credit. In fact, over 60% of this credit is dollar based and ‘guaranteed’ by the U.S. government. The minor little problem now is that we have reached ‘debt saturation’ levels everywhere. There are no more asset classes left able to take on more credit (air) to inflate the balloon. The other minor detail is that the ‘asset’ that underlies the value of everything (the dollar and thus Treasury securities) is issued by a bankrupt entity. What could possibly go wrong?”

Discussion

Growing and healthy economies mean more people are productively employed. It appears that much of the “growth” in the U.S. economy over the last five years has been in disability income, food stamps (SNAP), unemployment, student loans, welfare, debt, and government jobs – none of which are productive. Examine the following graph of Labor Force Participation Rate – the actual percentage of the populace that is employed. Does this look like a healthy economy experiencing a recovery or a collapse in productive employment?

The damaging effects of 100 years of Fed meddling in the U.S. economy, many expensive wars, 42 years of unbacked debt based currency, and unsustainable growth in credit and debt have left the Western monetary system in a precarious position.

Using common sense, ask yourself:

  1. Can total debt grow much more rapidly than the underlying economy which must support and service that debt? FOREVER?
  2. Can government expenditures grow much more rapidly than government revenues? FOREVER?
  3. Will interest rates remain at multi-generational lows? FOREVER?
  4. Will a fiscally irresponsible congress rein-in an out of control spending system that our fiscally irresponsible congress created?
  5. Is another and larger (than 2008) financial collapse likely and inevitable?
  6. Do you still believe in the fantasies of ever-increasing debt, printing “money” and credit bubbles? Are you personally and financially prepared for a potential financial collapse?
  7. Have you converted some of your digital currencies into real money – physical gold and silver? Is it safely stored outside the banking system and perhaps in a country different from where you live?

Read: The Reality of Gold and the Nightmare of Paper
Read: What You Think is True Might Be False and Costly

GE Christenson
aka Deviant Investor

Gold and Silver Soar As Fed Rejects Tapering and Revs Up The Printing Presses

Physical-GoldThe months long guessing game on whether or not the Fed would start tapering its $85 billion per month of treasuries and mortgage securities came to a conclusion today as the Fed promised to keep the printing presses going full blast.

Many analysts had come to the conclusion that the economy had strengthened enough for the Fed to begin reducing monetary stimulus but they were wrong as Fed, in Surprise Move, Leaves Bond-Buying Intact.

The Federal Reserve postponed any retreat from its long-running stimulus campaign Wednesday, saying that it would continue to buy $85 billion a month in bonds to encourage job creation and economic growth.

As Congressional Republicans and the White House hurtle toward another showdown over federal spending, the Fed said it was concerned that fiscal policy once again “is restraining economic growth,” threatening to undermine what the Fed had described just months ago as a recovery gaining strength.

Proponents of aggressive asset purchases, including Mr. Bernanke, also face mounting pressure from internal critics who argue that the modest benefits of bond-buying are increasingly outweighed by the risk that the Fed is encouraging excessive speculation or interfering with normal market function.

Some critics inside and outside the Fed have even begun to argue that the central bank’s bond-buying is preventing a return to normalcy.

“The economy is positioned to benefit from modestly higher longer-term interest rates,” Ms. George said earlier this month. She noted that higher rates could increase the income of retirees and bolster bank profits without a commensurate increase in risk-taking.

Despite the growing criticism of his securities purchase program the Fed decided that the time was not yet right for reducing the one trillion dollar securities purchase program which is financed by the Fed’s money presses.  According to the FRB press release:

Taking into account the extent of federal fiscal retrenchment, the Committee sees the improvement in economic activity and labor market conditions since it began its asset purchase program a year ago as consistent with growing underlying strength in the broader economy. However, the Committee decided to await more evidence that progress will be sustained before adjusting the pace of its purchases. Accordingly, the Committee decided to continue purchasing additional agency mortgage-backed securities at a pace of $40 billion per month and longer-term Treasury securities at a pace of $45 billion per month.

The Fed has already blown up its balance sheet to $4 trillion and the federal government has almost tripled its debt load to $17 trillion from $6 trillion in 2002.  After this massive stimulus of $15 trillion into the economy, the Fed now tells us that more is needed.

US Debt

Today’s actions tell us that the Fed will never find an opportune time to reduce its money creation and the gold  and silver markets reacted accordingly.  After the Fed’s announcement gold skyrocketed by over $50 per ounce and silver shot up by almost $1.50 per ounce.

The reasons for holding gold and silver have never been stronger despite the recent pullback in prices and today’s announcement by the Fed serves to further prove this assertion.

gold soars

silver soars

Gold Could Quickly Rally Over $2,000

tenth oz gold-eaglesBy GE Christenson:

Background: Gold prices peaked in September 2011 and have dropped over one-third in the past 22 months. Sentiment by almost any measure is currently terrible. Few in the US are interested in gold (although gold is selling well in China), most have lost money (on paper) if they bought in the last two years, and the emotional pain seems considerable. It reminds me of the S&P, gold, and silver crashes in 2008-9.

So, will gold drop under $1,000 or rally back above $2,000?

To help answer that question, I examined the chart of gold for the last 25 years and identified several long-term cycles. Then, I constructed a spreadsheet that attempted to model the price of weekly gold based on those cycles and a few assumptions.

Assumptions

  • Use only long-term cycles – a year or longer.
  • The weight assigned to each cycle is approximately proportional to its length. A 200-week cycle should be approximately twice as heavily weighted as a 100-week cycle.
  • This is NOT a trading vehicle but a long-term indication of reasonable price projections based on past relationships. Those past relationships may or may not continue, even if they have been valid for over 20 years.
  • Keep it simple. Do not over-complicate the model or aggressively “curve-fit” it.
  • Prices are assumed to rise more slowly than they fall, so 62% of the cycle is related to the rising portion of the cycle, and 38% of the cycle is related to the falling portion of the cycle.

Data

Low-to-Low cycles: 100 weeks, 122 weeks, and 162 weeks

High-to-High cycles: 88 weeks and 270 weeks

Exponential growth: 1/1/1990 – 1/01/2002: growth of negative 3.0%/year, and 01/01/2002 – present: 18% per year, calculated weekly

Process

Find the beginning dates (lows) for the 100, 122, and 162 week cycles and assign those beginning dates an index value of -1.0. Proportionally increase those index values from -1.0 to +1.0, and then reduce those index values from +1.0 to – 1.0, and repeat for each low-to-low cycle. Use the beginning index value on the 88 and 270 week high-to-high cycles as + 1.0. Extend the proportional increases on all time cycles from -1.0 to + 1.0 so that the rising period takes 62% of the cycle time.

Assign each cycle a weight approximately proportional to the cycle length. Use a beginning value and calculate the exponential increase (-3% or +18% per year) for each week, and then add or subtract the percentage changes for each weekly time cycle. Adjust the cycle index weights to obtain the best visual fit on a graph of actual gold prices versus the calculated price of gold.
What Could Go Wrong?

The exponential increase might not continue from 2013 forward. I expect gold prices to accelerate higher, but it is possible that they will continue falling. See Caveats.

The cycles, although relevant for over 20 years, might be less relevant from 2013 forward.

The calculated price was “curve-fit” to the actual prices, and that “curve-fit” result might be less accurate from 2013 forward.

Results
Statistical correlation over the last 20 years is slightly larger than 0.97 (quite high). The calculated gold price is generally consistent with the actual gold price, even though occasional large variations are clearly evident.

Highlights: (based on weekly closing prices)
Calculated high: December 2006 at $779
Actual high: May 2006 at $712

Calculated high: April 2008 at $784
Actual high: March 2008 at $999

Calculated low: April 2009 at $618
Actual low: October 2008 at $718

Calculated high: August 2011 at $1,931
Actual high: September 2011 at $1,874 (daily high was $1,923)

Calculated low: July 2013 at $1,267
Actual low: July 2013 at $1,213 (actual weekly low, so far)
The Future

This simple model, which uses only five cycles and an exponential increase, indicates that a low in the gold price is expected approximately now (May – October 2013), and that the next high is projected for approximately September 2014 – June 2015, possibly in the $2,500 – $3,500 range. (From the current lows, a price of $3,000 seems unlikely, but gold traded below $700 in October 2008 and rose to over $1,900 by September 2011, so a substantial rise is quite possible.)

Caveats!

There are many. This is not a prediction; it is simply a projection based on the entirely reasonable, but possibly incorrect, assumption that gold prices will continue to rise about 18% per year, on average, and that these five cycles will push actual prices well above and below that exponential growth trend.

Why will gold prices continue to increase? Our current monetary system depends upon an exponentially increasing debt and money supply. It seems likely that the US government will continue to run massive budget deficits and thereby increase total debt. In addition, the central banks of Japan, the EU, and the US will continue to monetize debt and increase the money supply to promote asset inflation and to overwhelm the deflationary forces in their respective economies. Gold supply increases slowly, the demand increases more rapidly, while each Dollar, Euro, and Yen purchase less, on average, each year. It seems quite reasonable to expect that gold (and silver) prices will increase substantially from their current low level. Read: Gold & What I Know for Certain.

Timing: The model was basically correct (over the last decade) on timing and price with some large variations. Clearly, there are more factors driving the price of gold than five simple cycles. Those political, HFT, emotional, and economic factors will inevitably push the price higher or lower, sooner or later, than the model indicates. Regardless, the model has some value indicating the approximate price and timing for long-term highs and lows in the price of gold.
Use it while appreciating its limitations. Read: Back To Basics: Gold, Silver, and the Economy.

GE Christenson
aka Deviant Investor

Has The Price of Silver Already Discounted Weak Investment and Industrial Demand?

american-silver-eagle
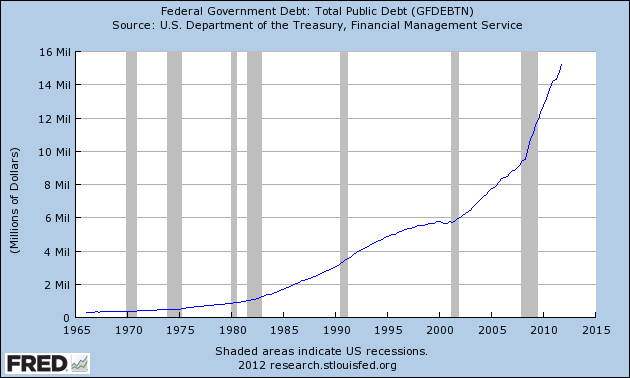
Precious metals analyst Suki Coper at Barclays takes a look at the silver market in an interview with Bloomberg Television.

Silver investors have endured a brutal year as the price of silver declined by $12.20 or 39.5% since  the beginning of the year.   Will the price of silver quickly recover as it did after the 2008 collapse or have the fundamentals changed so significantly that a price recovery may be years away?

Suki Coper notes that silver is struggling to find support from both industrial and investment demand which has turned “quite weak.”  Markets are a discounting mechanism and weak demand seems to already be reflected in the price of silver.  The next price move in silver may hinge on whether or not silver demand recovers from this point or continues to decline.

Ms. Coper notes that imports of silver by China, which had been an area of price support, are at the lowest level since January 2006.  The recent slowdown in economic growth in China along with a looming banking crisis does not bode well for a pickup of industrial demand for silver.

The influence of the Federal Reserve on silver could also be negative if the Fed gets more hawkish in its monetary policies.

“Sentiment on Gold and Bonds Incredibly Negative” – Marc Faber Predicts Endless QE

Liberty-EagleIts hardest to buy at bottoms since you never know where the bottom is.  Equally hard to do is to buy when the sentiment is incredible negative as it was in early 2009 for stocks and 2000  for gold and silver.

Marc Faber, editor of Gloom Boom & Doom Report discussed the current status of the global markets and investment strategies on Bloomberg Television.

Faber said that the sentiment on gold and bonds in incredible negative and that the Fed, regardless of who winds up replacing Bernanke, will be forced to engage in endless monetary stimulus.   According to Faber “as I said already three years ago, we are going to go with the Fed to QE99.”

Faber notes that the cost of living continues to increase  on a global basis and the benefits of QE are mainly benefiting the richest members of society who hold large amounts of assets.  As money printing destroys the purchasing power of the middle class there will be worldwide social unrest which has already erupted in numerous countries.

As to what the price of gold will be at year end, Mr. Faber declined to speculate saying that “I am not a prophet but I will continue to buy gold.”

Gold and Silver Investors Need to Ask Themselves 10 Basic Questions

1933-double-eagle1Rick Rule listed 10 key questions regarding today’s economy. They are:

10 Questions for Precious Metals Investors

  • Is the financial crisis in the Western world over?
  • Have the G20 countries balanced their budget?
  • Did the commercial banks manage to become solvent?
  • Are (real) interest rates positive or negative?
  • Is a global competitive devaluation to increase exports still ongoing?
  • Is the European periphery still financially challenged?
  • Do the Asian countries still have a cultural affinity with precious metals?
  • Which are the US budgetary issues and solutions?
  • Are the derivatives from large banks still a problem for economies and client portfolios?
  • Can liquidity solve the issue of insolvency?

If these are the questions, then gold and silver are two good answers.

But, let’s approach these questions from a different direction.

  • Have gold or silver ever defaulted?
  • Do gold or silver have counter-party risk like EVERY paper investment?
  • On January 1, 2000 the Dow was about 11,500, gold was priced at $289, and silver was priced at $5.41. As of May 24, 2013, those numbers were: Dow: 15,303, gold $1,386, silver $22.49. Which was the best investment?
  • Gold fell (in 21 months) from over $1,900 to about $1,320. Does that mean the gold bull market is over? The Dow crashed from 14,100 (October 2007) to about 6,500 (March 2009), and then rallied back to new highs. Don’t exclude the possibility of new highs for gold and silver in the coming months.
  • Why are Chinese businesses, individuals, and their central bank buying gold as rapidly as possible? Why does the Chinese government refuse to allow any gold to be exported? Why does China (world’s largest gold producer) additionally import a massive amount of gold every year?
  • Ask the same for Russia, India, and much of Asia. What do they know about the VALUE of gold that the EU and the USA (who are selling gold) don’t understand?

Further:

  • Gold and silver have gone up and down, when priced in unbacked paper currencies. The same is true for trucks, diamonds, the Dow Index, laundry detergent, gasoline, cigarettes, and wheat. Price increases and volatility will continue.
  • Gold, silver, and the national debt have increased exponentially since Nixon severed the link between the dollar and gold in 1971. All three will continue to rise. Gold and silver will occasionally rally too far and crash, while the national debt will increase until politicians no longer enjoy spending other people’s money.
  • Goldman Sachs (and many others) have said gold is in a bubble. The same individuals and groups probably did not see the bubble in Internet stocks and housing. Do you trust them or the 3,000 years of history during which gold and silver have been real money and a store of value?
  • If JP Morgan (and others) can make huge profits using computers, complex mathematical algorithms, and High-Frequency-Trading, then they will. Often their trading temporarily drives the prices for gold and silver down. After the markets have been driven far enough down, the same trading process is used to drive the prices higher. Expect it!
  • Silver has dropped from about $49 (April 2011) to just above $20 (May 2013) – almost a 60% drop in price. Does that mean it will continue to drop more – perhaps to $10? Silver has retained its value, on average, for 3,000 years but has fallen in price for two years. On the basis of price action in those two years, most individuals (based on sentiment measures) have chosen to trust unbacked paper currencies issued by an insolvent central bank and an insolvent sovereign government instead of silver. This is typical of market bottoms, even if it is not sensible.
  • About 4.5 years ago (October 2008) silver crashed to a price bottom where “everybody felt” like it was hopeless to expect silver to rally again. About 4.5 years before that (May 2004), silver also crashed to a price bottom where “everybody felt” like it was hopeless to expect silver to rally again. But, in fact, the silver rally off the low in 2008 was over 450%, and the rally off the 2004 low was over 175%. Silver will rally again.
  • We may not trust bankers and politicians to effectively run the country, but we can trust them to “print money” and to spend in excess of their revenues. Consequently, we should trust them to drive the prices, as measured in unbacked paper currencies, for gold and silver – MUCH higher.

GE Christenson
aka Deviant Investor

Why All Governments Hate Gold

bars-of-goldMOTIVE: The various governments of the world and their central banks produce and distribute a product – paper currencies. Those currencies are backed by confidence, faith, and credit, but not by gold, oil, or anything real. Those currencies are digitally printed to excess, since almost all governments spend more than their revenues. The UK, Japan, and the USA are prime examples.

Politicians want to spend more money, but they also need to maintain the illusion that the money is still valuable, that it will retain most of its purchasing power over time, and that inflation is under control. The illusion weakens when food, gasoline prices, and other consumer goods are wildly rising in price. At a more abstract level, gold indicates the same lack of confidence in the printed pieces of paper that our central banks distribute.

Hence, central banks and governments have a strong motive to “manage” the inevitable price increases in gold. They have a motive to suppress the price and to allow it to rise gradually over time, while occasionally smashing it down and temporarily destroying confidence in gold as an alternative to unbacked paper currencies. The press helps by regularly claiming gold is in a “bubble.”

Yes, there is a clear and compelling motive.

MEANS: This brings up a heavily debated topic – do governments and central banks have the means to manage the price of gold? Ask yourself these questions:

  • Did banks manipulate rates in the LIBOR market?
  • Does the Federal Reserve (and other central banks) set (manage – manipulate) interest rates in the credit markets?
  • Do banks exercise considerable influence over regulators and Congress?
  • Are the various central banks of the world centers of power and wealth?
  • Do they use their wealth and power to achieve their policy objectives?
  • If the Fed can create and lend/loan/swap/give away over $16 Trillion dollars after the 2008 crisis, is it possible that some of that $16 Trillion was used to influence the gold market?
  • Did Greenspan, when he was Chairman of the Federal Reserve, make a statement in 1998 that central banks were ready to lease gold if the price of gold rose? Link is here.
  • If central banks lease gold to bullion banks and those banks SELL that gold into the market, would that have any influence on price?
  • Are central banks allowed to claim leased gold, which they no longer physically possess, as an asset on their balance sheet? (Lease it into the market but still claim they have it – this works until they run out of gold or the physical gold is audited.)

Yes, central banks and governments have the MEANS to suppress the price of gold.

OPPORTUNITY: As long as:

  • Governments spend more than their revenues
  • Central banks and governments control their gold in secrecy
  • Physical gold is not audited (last real audit of the USA gold was about 60 years ago)
  • Gold can be leased out while being listed as owned,

then there is opportunity.

Further, if a few billion dollars can be created and then used by a futures trader, and that trader sells (naked shorts) a large number of gold contracts on the futures exchange, that will drive the gold price down rapidly. Look at the chart of gold prices for April 11 – April 16 and ask yourself if that looks like a managed market.

Yes, central banks and governments have the OPPORTUNITY to suppress the price of gold.

But there is more to the story!

Central banks and governments have, to one degree or another, the motive, means, and opportunity to manage the price of gold. Clearly, their bias is to hold the price of gold low and to restrict its upward movement. Similarly, they want bond and stock markets to move higher, but that is another story.

YOU have motive, means, and opportunity to protect yourself and to profit from this process.

You know that unbacked paper currencies are declining in purchasing power. The path is erratic but clearly lower over the last four decades. You want to protect your purchasing power – you have a MOTIVE to own gold instead of owning devaluing currencies that pay next to nothing in interest.

You probably have paper dollars that are “invested” in stocks, bonds, IRAs, and other savings. You have the MEANS to protect yourself. Sell some paper and buy gold. The Chinese and Russians are doing it as rapidly as they can. What do they see that you might not fully understand?

You have the OPPORTUNITY to buy gold and silver at a huge discount to their real value – just my opinion – but both are “on sale” at current prices. (Gold is currently priced about the same as in late 2010.) “But can’t they go lower?” Yes, of course, gold could drop to $1,000, the Middle East could be transformed into a region of tranquility, peace, and cooperative people, and the US Congress could balance the budget. But as long as governments and central banks are “pushing paper,” digitally printing unbacked currencies, and overspending their revenues, the price of gold will increase – just my opinion – to much higher than it is today.

Gold and silver are in long-term bull markets. One of the objects of a bull market is to arrive at the peak with very few long-term participants. The “bull” wants to buck you off periodically. It usually happens. Basic human nature – fear and greed – makes it difficult to ride the bull most of the way up and exit at the proper time. Fortunately for gold and silver bulls, there are many more years of deficit spending and increasing debt that will push metals prices much higher.

Read from the DI: Why Buy Gold?

GE Christenson
aka Deviant Investor

Why I Will Always Own Gold and Silver

What I Know for Certain –  By:  GE Christenson

gold-dollar

      • Death and taxes!
      • Fear and greed are powerful motivators.
      • Individuals, businesses, and governments do what they think is beneficial for them.
      • Businesses and governments protect their products and territory and resist competition and enemies.
      • Concentrated wealth creates power and corruption. The greater the concentration of wealth, the larger and more pervasive the power and corruption.
      • Gold and silver have been money for over 3,000 years.
      • Unbacked paper money systems have always failed.

What I Think is True

      • The basic product of a central bank is the unbacked paper currency it prints in ever-increasing quantities.
      • Central banks will fight all competitors to their currencies. The oldest competitor to unbacked paper currencies is gold, ancient money.
      • Politicians want to spend money and increase their power.
      • Bankers want to create money, lend it to governments, and thereby secure a permanent and increasing revenue stream.

What I Think the Consequences Are

      • Bankers use their wealth to “influence” politicians. Politicians respond with favorable legislation. It has worked for centuries.
      • Central banks want an expanding money supply and ever-increasing debt. The consequence is that consumer prices inevitably increase.
      • A currency collapse is like a bank run – everyone scrambles to remove his/her wealth from the currency (or the bank) due to a loss of confidence. In fractional reserve banking systems, bank runs are inevitable. Even though they may last for many decades, unbacked paper currencies inevitably devalue and eventually collapse.
      • Bank runs and currency collapses are feared by bankers and politicians; they do what they can to support confidence in their products and to squash their competitors.

In the United States

      • Debt and government spending seem likely to increase until a crash-reset occurs.
      • The crash-reset will involve a dollar collapse.
      • Gold and silver will eventually reach much higher prices due to the loss of value and confidence in the dollar, the banking system, and the sustainability of the current financial system.
      • “Paper gold” will be seen for what it is – a promise that might not be paid.
      • Physical gold will be seen for what it is – real wealth.
      • The USA and Europe are sending their real wealth – gold – to China, India, Russia, and the Middle East. China, India, and Russia are buying aggressively and know that exchanging paper dollars and euros for gold will strengthen their economies and governments tomorrow.
      • It is openly speculated that much of the sovereign government and central bank gold supposedly owned by the USA and Europe is either gone, leased, or otherwise committed.

Read: The Crash Before the Climb

Accept what you cannot change and act based on facts, not our current financial and economic fictions. Protect your financial well-being with physical gold and silver safely stored in a secure location.

GE Christenson
aka Deviant Investor

Is The Decline In Gold Predicting Deflation?

bernanke's paperBy GE Christenson

We all know that our cost of living in increasing, but how much?

The official government statistics assure us that inflation is running around 2% per year. It reminds me of the line attributed to Groucho Marx, “Who are you going to believe, me or your own eyes?”

But, your cost of living increase – your personal inflation rate – may be much larger or smaller than that of the person next door. Your spending choices matter a great deal in determining your personal inflation rate.

  • I think we can all agree that some items are increasing much faster than others. A few that come to mind are college tuition, medical care, hospital costs, and health insurance. Several that increase more slowly are postage and milk. If you spend more on medical care and health insurance than on postage, your cost of living increase will be much larger than the person who buys more stamps than health care.
  • If the official CPI goes up, then social security payments increase and total government expenses increase. Hence, government has an incentive to want low CPI inflation statistics. The US government has changed the process and the formula several times since the 1980s. The result, of course, is that the official CPI is low. Maybe it is fair, maybe not, but it is the official story, and it helps keep social security payments low.
  • The various statistical measures used to calculate the CPI have been discussed and criticized in detail in many other publications. In the opinion of many people, they don’t reflect economic reality for most people.
  • Other writers disagree and assure us the inflation rate is low.
  • John Williams, a competent economist and statistician, computes the annual inflation rate at about 9%. He uses the statistical calculation process that was used by the government in 1980.
  • Dennis Miller did an inflation rate survey. It was not intended to be statistically robust – just practical. His readers responded with an average inflation rate of 8%, but 23% of the respondents thought their personal rate of inflation was over 11% per year.
  • The Deviant Investor did a similar survey and received a large number of responses. Our readers thought their average inflation rate was nearly 8% per year, while 39% thought it was higher than 9% per year.
  • Rex Nutting thinks it is close to 3% per year and that most of us are “CPI Deniers.” Mainstream media mostly agrees – but I can’t find anyone (in casual conversation) in a grocery store who thinks food prices are only increasing 2 – 3% per year.

I estimate my personal inflation rate at about the average found in the surveys – around 8% per year. I am one of those “CPI Deniers.” Most people I know are “CPI Deniers.”

So How Important is a Few Percent Per Year?

A few percent seems unimportant, but over a decade it becomes very important. Let’s assume in this very simple example that your expenses increase 8% per year, and your income increases 3% per year. In year one your income was much larger than your expenses, and you saved the difference.

Sample Inflation Calculation

Year Income Expenses Net to
Savings
1 80,000 60,000 20,000
2 82,400 64,800 17,600
3 84,872 69,984 14,888
4 87,418 75,583 11,835
5 90,041 81,629 8,411
6 92,742 88,160 4,582
7 95,524 95,212 312
8 98,390 102,829 (4,440)
9 101,342 111,056 (9,714)
10 104,382 119,940 (15,558)

By year 8, in this simple example, the cost increases overwhelmed your income, and you were forced to withdraw from savings. Of course, in the real world, there are more variables and adjustments. We cut back on expenses, increase credit card debt, take a second job, win the lotto, file for bankruptcy – whatever. But the critical point is that your personal inflation rate is important, and a few percent over a decade can make a huge difference.

What to Do?

      • Cut back on expenses.
      • Get out of debt, and stop paying interest.
      • Increase your income.
      • Start a business, or take a second job.
      • Make investments that pay more than the minimal interest provided by savings accounts and certificates of deposit.
      • Invest in real things – gold, silver, diamonds, land, rental property.
      • Invest in “ABCD,” which for David Stockman is “Anything Bernanke Can’t Destroy.” We Have Been Warned!

According to the surveys, real people think their personal inflation rate is around 8% per year with a significant percent of the responders claiming 9 – 11% or more per year. Are you going to believe what the government is telling you or your own experience?

GE Christenson, aka Deviant Investor

Where Does Silver Go From Here?

silver-eagleBy: GE Christenson

You bought silver with high expectations! Then it crashed while endless news reports informed you that silver would drop even further. Frustration! Misery! Despair! Depression! You have lived it all. There was no light at the end of the tunnel.

Darkness and despair covered the land of silver. There was no joy in silver-ville.

But, then from the depths of despair and ugly bearish sentiment, a rally materialized. But, not just a small rally, a HUGE RALLY – TOTALLY AWESOME! The price doubled in a few months. Then it paused, scared some of us out, and rallied even further. You heard that silver was going to $100 or maybe $200 per ounce. Analysts outdid each other with higher and higher projections. You congratulated yourself on your foresight and financial acuity by investing in silver – sheer genius – forgetting that you almost sold out for a loss at the bottom. The manic phase is great while it lasts…

Silver rallied, and you waited for even higher prices before you sold. If you were rational or just lucky, you sold out before it crashed 25% in a week. If you did not sell out, you screamed to anyone who would listen, “they crashed it,” and “I should have sold out before the crash,” and “it’s not fair.”

Silver investing felt like a bipolar roller coaster ride – manic up followed by depressing down. You began to self-medicate with alcohol and wishful thinking. You sought out others who agreed with you, told you what you wanted to hear, and…

… it goes on and on.

STOP!

I repeat. STOP with the bipolar behavior, the delusional thinking, the self-medicating, and the emotionally debilitating ups and downs. It is not good for your physical, emotional, or financial health. Just stop, hit the silver reset button, and reassess.

  • Silver is heavily manipulated by the big players (JP Morgan, etc.) – what else would you expect? They are in the business to make profits, and their profit at YOUR expense is just fine with them. No need to worry about the DOJ, congress, or any regulators … for obvious reasons. So just admit it, the price is managed and manipulated, the “fix is in,” and that is exactly what we should expect. But, it is still a better investment than most paper.
  • Silver has gone up, from January 1, 2000 (a good place to start) to the LOW in April 2013 about 14% per year. One more time, what is wrong with 14% per year?
  • Silver rallied from under $9 in October 2008 to a high of nearly $49 on April 29, 2011. The next week it crashed to a low of about $35, briefly bounced, and then fell again to a low of about $26 in June of 2012, rallied to about $35 in October, and fell again to about $27 in early April 2013. That was a wild ride on the bipolar silver roller coaster.
  • Since 1971 when Nixon severed the already tenuous link between the dollar and gold and encouraged money creation to accelerate, silver has risen, on average. about 7% per year, compounded annually, for 42 years. It will go higher because the value of paper currency is almost certain to continue its decades’ long decline.
  • Central banks around the world are printing money, expanding the money supply, and doing what they can to suppress the price of gold and silver. Given the financial mess they have created, what choice do they have? So expect money printing and erratic silver rallies to continue.

For your emotional and financial sanity and physical health, get off the bipolar silver roller coaster, buy physical silver, relax, and watch the spectacle as the central banks of the world drive the value of paper currency toward zero and the value of silver to $100 or $200 or $300 per ounce. You own it for insurance and to preserve purchasing power, so there is no need to fixate on the daily or weekly price, except to buy more at bargain prices – like now.

Again: Why do we own silver?

Read:

GE Christenson
aka Deviant Investor