May 5, 2024

Gold and Silver Paper and Physical Markets Realign

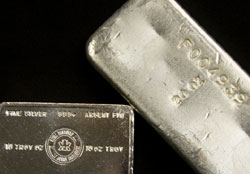
Late last year and early this year, a continual observation of the gold and silver markets was the disconnect between the prices quoted on paper markets and the prices that you would actually need to pay to buy physical precious metals. In the past few weeks premiums for physical gold and silver have declined as the prices quoted on the paper market have risen, basically bringing the two markets back into alignment.

Back in October 2008, I had examined 100 ounce silver bars as an example of the excessive premiums being paid for physical precious metals. I collected some data from recently completed eBay auctions that showed the average price of the 100 ounce silver bar ranging from $1,329 to $1,557 while the market price of silver ranged from $8.88 to $10.89. This represented premiums ranging from $39.62% to 56.45%. This was particularly ridiculous since the 100 ounce silver bar has been traditionally viewed as a low premium method for silver investing.

Reviewing some data for eBay auctions completed yesterday now shows the prices paid for 100 ounce silver bars ranging from $1,450 to $1,500. At yesterday’s closing price of silver of $14.09, this represents a much more reasonable premium of about 3% to 6%.

Peculiarly, the decline in premium is a close match to the increase in price for spot silver. If you invested in silver by buying physical bars back in October, you might be showing zero profit even though the market price is up over 40%.

Future Gold and Silver Price Implications?

When the premiums for physical precious metals were high, it was viewed as a sign of heavy demand amidst a diminished supply that would eventually force market prices to move higher. Now that the disconnect between the paper and physical markets has seemingly resolved itself, is this a signal of slower demand that will lead to lower prices?

Despite the implication of slower demand, I think the realignment of the markets represents a long term positive for the price of gold and silver. Back when premiums were high, I am sure that many potential investors backed away from the market when they were faced with excessive premiums. Potential investors will now actually be able to buy physical gold and silver around the market prices. This is a much better environment for fostering mainstream demand to keep gold and silver moving higher.
[phpbay]100 ounce silver bar, 3, “”, “”[/phpbay]
US Mint Bullion Sales for April 2009

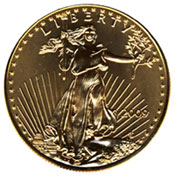
The US Mint’s bullion sales figures for April 2009 remained robust. The amount of gold bullion sold during the month was the highest of the year. Silver bullion sold was the second highest figure for the year. Once again, the US Mint did not sell any platinum bullion coins. This offering has been delayed with no indication of when sales might begin. Similarly, the 24 karat Gold Buffalo coins were not offered as they are also delayed.
The sales totals for all bullion coins offered by the United States Mint are presented below.

April 2009 US Mint Bullion Sales
1 oz. 1/2 oz. 1/4 oz. 1/10 oz. Total oz.
Gold Eagle 147,500 147,500
Gold Buffalo
Silver Eagle 2,518,000 2,518,000
Platinum Eagle

There were 147,500 ounces of gold sold during April 2009. This consisted entirely of one ounce gold coins, as fractional coins were still not offered.This represented the highest sales level of the year to date. The prior month had sales of 136,500. Sales for the year ago period of April 2008 were 47,500 ounces.

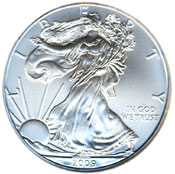
There were 2,518,000 ounces of silver sold during April 2009. Silver bullion sales continue to be at higher levels, on pace for a record year. Since the coins are subject to rationing, this might be an indication that the Silver Eagle shortage might be ending. The prior month silver bullion sales were 3,132,000. Sales for the year ago period of April 2008 were 1,584,000.

Palladium Bullion Coins Proposed

With the price of palladium down from the peak price reached during 2008, there seems to be increased interest in creating methods for investing in palladium. I previously wrote a post on the proposal to create a palladium ETF. Now there is a proposal for a United States palladium bullion coin.

A bill was introduced in the United States Senate on April 1, 2009 to create palladium bullion and numismatic coins for the year 2009. The coins would bear the design of the 1907 Ultra High Relief Gold Double Eagle and contain one ounce of .995 palladium. The bill was sent to committee and the prospects of becoming law are uncertain.

According to data from Johnson Matthey, palladium supply for 2008 was 7.51 million ounces while demand was 7.19 million ounces. Investment demand only accounted for 4% of overall demand.

There are no palladium bullion investment coins currently produced by any of the major world mints. The Royal Canadian Mint briefly offered the Palladium Maple Leaf. The coin was only offered from 2005 to 2007 before it was discontinued. They sold approximately 40,000 in 2005, 70,000 in 2006, and 15,000 in 2007.

Current methods of investing in physical palladium are primarily one ounce palladium bars or the Palladium Maple Leaf coins. The coins usually carry premiums of over 50% and it can be difficult to locate a bullion dealer who keeps them in stock. If a new palladium bullion coin is produced, it would likely be available for much lower premiums and much easier to locate.

Is the Silver Eagle Shortage Ending?

World mints have struggled to keep up with the booming demand for precious metals. The situation has been ongoing for more than a year and frustrated physical silver investors with suspensions, rationing, and delays. There are finally some signs that the shortage may be coming to an end, in particular for the American Silver Eagle bullion coin.

The Silver Eagle shortage first began in February 2008. The US Mint became so overwhelmed with orders for the popular silver bullion coin that they were forced to suspend taking new orders. The suspension was only in place until March 2009, however, sales were resumed on a rationed basis. Authorized purchasers were limited in the number of coins that they could order. Early suggestions indicated that the rationed amounts covered only a fraction of the overall demand.

More than one year later, there are some indications that the situation may finally be abating. As I mentioned in my post on the US Mint’s March 2009 Bullion Sales, sales of silver and gold reached extremely high levels. Sales of silver coins were actually the highest monthly total since 1986. Since these are rationed sales, the high level was more of an indication of reduced supply constraints than increased demand.

Recently, there have been more indications at the dealer level that the shortage may be ending. One  dealer has reported that delays for delivery of Silver Eagles are shortening, and premiums for the coins is declining. At the height of the shortage premiums were as high as $4.50 over the spot price of silver. Premiums have now pulled back to around $3.00 over spot.

Half Gram Gold Coins

The World Gold Council recently announced their plans to attempt to popularize half gram gold coins. The plan seems mostly targeted towards consumers in India, in advance of the upcoming festival.

How small is a half gram of gold? There are 31.1034768 grams in one ounce. If you are familiar with the one-tenth ounce size gold coin, a half gram of gold would be about one-sixth of that size. The value of one half gram of gold based on Friday’s gold closing price would be about $14.68.

The story about half gram gold caught my attention because it is the opposite of what’s happening with gold in other parts of the world. As the price of gold increases, it makes sense to popularize smaller size coins or bars so that a mainstream audience will continue to have options for investing in gold. In the United States, smaller sized coins have actually been suspended in favor of producing only one ounce coins.

This step was taken by the US Mint at the end of 2008. At least one other world mint that I follow, took similar action. For all of 2009, the US Mint has only produced gold bullion coins in the one ounce size. Based on the current price of gold plus the standard markup, the price tag for the smallest possible gold purchase approaches $1,000. This may be out of reach for many potential investors.

In advance of Y2K, there was a renewed interest in precious metals investing as a disaster hedge. Even mainstream consumers began to buy into the story, bringing in many new gold investors with budgets both large and small. When Y2K precious metals investment reached its peak in 1999, the US Mint sold 2,750,338 1/10 ounce gold coins which would have cost around $40 each. The 275,000 ounces sold via 1/10 ounce coins actually exceeded the total amount of gold bullion sold by the US Mint for some prior years.

The current lack of fractional sized bullion coins has effectively cut off a significant portion of gold investment demand. Importantly, this is demand which would come from a mainstream investment audience, which gold currently lacks.

How to Value Gold, Gold Mine Output, Gold Coin Minting

An array of recent gold related articles to ponder as the price of the metal dips to $874 per ounce.
Gold Revisited

How do you value gold? Here’s a very thoughtful answer to the question based on a ratio of gold to the global economy and global asset base.

Gold mine output in 2008 lowest in 12 years

As the output from gold mines has declined, the total cash costs have expanded. The average increase was almost 20% against 2007.

Gold coin minting hits 40%

Interesting to consider in light of the previous article. While gold output has declined, gold coin minting has increased by 40%. Other gold investment options such as bars and ETFs have also drawn an increasing amount of gold.

GATA Renews Requests to Treasury, Fed for Gold Data

Will President Obama’s call for greater opnness in government, result in teh reveleation of information related to the U.S. gold reserves?

Accumulate Silver Soon

The Got Gold Report takes a look at positioning by the largest silver players amidst increasingly tight supplies. The holdings of GLD and SLV remain steady, even as the prices of the metals pull back.

And something to reflect on from the opening paragraph, “as governments continued to find new ways to “fix” major economic problems caused by excessive borrowing with much more, ridiculously excessive borrowing, relaxing accounting standards and now even using the U.S. government’s printing press to “buy” its own treasuries (diluting all dollars in the process) … while those seeds of inflation and eventual debasement of all fiat currencies wound up – gold and silver continued to correct lower. “

Platinum ETF and Palladium ETF Coming Soon?

ETF Securities USA recently filed with the SEC to launch exchange traded funds covering platinum and palladium. There are currently no exchange traded funds covering these metals available in the United States.

The same firm already offers ETFs for platinum and palladium which trade in Europe. According to the Wall Street Journal, the platinum holdings for the ETF approach 500,000 ounces.

Rumors of a platinum ETF for the US market briefly made the rounds back in May 2007 after the launch of the European ETFs. The rumors were quickly squelched as it was viewed as unlikely that the SEC would approve such a listing. At the time, the world’s largest platinum producers were reportedly unsupportive of the idea and pressure from the US auto lobby against the ETF was viewed as likely.

With platinum more than 50% off its peak and auto manufacturers dealing with larger issues, there doesn’t seem to be as much resistance this time around.

Here you can view the SEC filings for the proposed platinum and palladium ETFs. The filings indicate that the price per share would be equal to the value of one-tenth of an ounce of each metal.Today, platinum traded at $1,175 and palladium traded at $231. The filings include world supply and demand figures for the metals for the past ten years. In 2008, reported supply exceeded reported demand for both platinum and palladium.

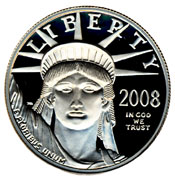
The ETFs would be launched at a time when obtaining physical platinum and palladium for investment continues to be difficult or at high premiums. In order to buy physical platinum in coins or bars, premiums can be $100 or more – if you can find them. The US Mint delayed the 2009 launch of their platinum bullion product the Platinum Eagle. This delay has continued without any update. Physical palladium for investment is usually obtained in bars. The Royal Canadian Mint briefly offered the Palladium Maple Leaf from 2005 to 2007, but ended the program due to low demand.

US Mint Reports Highest Monthly Silver Bullion Sales Since 1986

As I have in the past, I have compiled the total bullion sales from the US Mint’s bullion coin programs. The numbers for March 2009 bullion sales carry a bit of a surprise. The US Mint recorded the highest monthly silver bullion sales since December 1986, which was the second month the silver bullion coins were offered.

During March 2009, the US Mint only sold one ounce American Gold Eagles and one ounce American Silver Eagles. They continue to delay production of the 24 karat Gold Buffalo coins, all Platinum Eagle bullion coins, and fractional versions of the Gold Eagle. The sales totals for the two available bullion coins are presented below.

March 2009 US Mint Bullion Sales
1 oz. 1/2 oz. 1/4 oz. 1/10 oz. Total oz.
Gold Eagle 136,500 136,500
Gold Buffalo
Silver Eagle 3,132,000 3,132,000
Platinum Eagle

Total ounces of gold sold during March 2009 was 136,500 ounces. This is an increase from the prior month when 113,500 ounces were sold. It’s a big jump from the year ago period of March 2008 when 50,000 ounces were sold.

Total ounce of silver sold in March 2009 was a whopping 3,132,000. This is up from the prior month when 2,125,000 ounces were sold and the year ago period when 1,855,000 ounces were sold. This represents the second highest total since the bullion coins were first offered in 1986. The highest total was attained for the month of December 1986 at 3,696,000.

There are two ways to interpret last month’s surge Silver Eagle bullion coin sales. As readers of this blog will know, the US Mint has cut, delayed, or suspended nearly every gold and silver product except for the one ounce Gold Eagle and Silver Eagle coins, which continue to be subject to rationing. That being the case, the level of sales is not really an indicator of demand, but an indicator of how many precious metals blanks the US Mint was able to obtain and mint into coins.

On one hand, the increased amount of sales could suggest that the scarcity for precious metals blanks is finally abating. The US Mint was able to obtain more blanks to produce bullion coins than any other month since the rationing program began in February 2008.

On the other hand, the demand for precious metals has continued in full force even during the month when the stock market supposedly “bottomed” and the world economy supposedly “turned the corner.” Beyond the reported sales, there also remains a wall of unmet demand ready, willing, and able to buy more silver when and if the rationing programs are ever removed.

Source for GLD Gold, SLV Silver Exceeds Capacity, Fort Knox Gold Audit

As gold turns lower on reports of a “turning point” for the entire global economy, let’s take a look at some thought provoking gold, silver, and precious metals related stories from other news sites and blogs. This round up includes stories on the Gold ETF and Silver ETF, a call for a return to the gold standard, Fort Knox, and prospecting for gold.

Where does the Gold ETF get its gold?

As the SPDR Gold Shares ETF marked a series of succesive all time highs for tonnes in the trust, many people started asking questions about where the gold was coming from. Here’s the answer.

SLV exceeds its silver storage capacity

Discussed in the Got Gold Report, the holdings for the iShares Silver Trust SLV have exceed the storage space allowed under its custodian agreement as the holdings reached another new high.

Russia backs return to Gold Standard to solve financial crisis

Following China’s call for a new world currency, Russia suggests that gold should be included in the basket-weighting.

Is there any gold inside Fort Knox?

It’s been decades since an independent audit of the reported $137 billion in gold stockpiled in Fort Knox has been independently audited. Ron Paul is pursuing a Bill to conduct an independent audit of the entire Federal Reserve System. Separately, GATA plans to file Freedom of Information requests for full disclosure of US gold ownership and trading activities.

The Great Credit Contraction

Trace Mayer, J.D. announces the availability of The Great Credit Contraction, which is a foundational document for much of the writing on his site Run to Gold.

New Gold Rush

Believe it or not, people are making money prospecting for gold in California. One prospector claims to have made $10,000 during one good day.

Gold, Silver & Platinum 2009 First Quarter Performance

With the first quarter at an end, let’s take a look at the performance of gold, silver, and platinum so far this year.

When putting the numbers together, I knew what to expect, but its still surprising to see where the final numbers landed. Gold, silver, and platinum’s performance relative to one another has basically been turned upside down from the 2008 annual performance.

2009 First Quarter Gold, Silver, and Platinum Performance
30-Dec-08 31-Mar-09 Change Percent
Gold 869.75 916.50 46.75 5.38%
Silver 10.79 13.11 2.32 21.50%
Platinum 898.00 1,124.00 226.00 25.17%

For 2008, gold had performed the best with a gain of 4.32%, followed by silver with a loss of 26.90%, with platinum in last place with a loss of 41.31%.

As you can see the performance for the first quarter of 2009 has been the opposite with platinum performing best with a gain of 25.17%, followed by silver with a gain of 21.50%, with gold in last place with a gain of 5.38%.

Platinum and silver were in some respects recovering from the beating they took last year. Over the past several years gold has emerged as more of a steady performer, as compared to the more volatile performance of the other metals, commodities, equities, real estate, etc. It’s ironic that whenever a mainstream publication discusses the possibility of investing in gold, they never fail to caution about gold’s “volatile” prices.

At any rate, precious metals outperformed stocks for the quarter, mostly by a wide margin. The Dow, S&P 500, and Nasdaq lost 14.29%, 12.81%, and 3.07% respectively.