April 19, 2024

US Mint Gold and Silver Bullion Coin Sales Decline in September

silver, goldDemand for American Eagle gold and silver bullion coins remained sluggish in September according to the latest figures from the U.S. Mint.

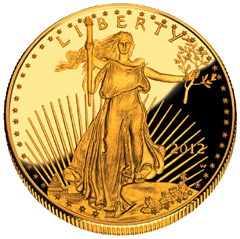
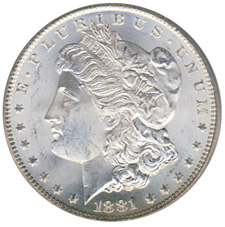
Sales of the American Eagle gold bullion coin totaled 13,000 ounces in September, off a considerable 77% from the previous year but up 13% from last month.  Sales of the gold bullion coin in August were only 11,500 ounces, the lowest monthly sales of the year.

The slowdown in gold coin sales marks a turnaround from the beginning of the year when demand for physical gold seemed insatiable.  April sales of the American Eagle gold coins came in at 209,500 ounces which was the largest sales month since December 2009 when 231,500 ounces were sold.

Despite the frenzy of money printing by banks around the world, gold bullion coin sales have declined every year since 2009 as the financial system stabilized.  Gold sales soared during the financial panic in 2009 to an all time high as nervous buyers sought safe haven in gold.

Yearly sales of the gold bullion coins are shown below.  The 2013 total is through September 3o.

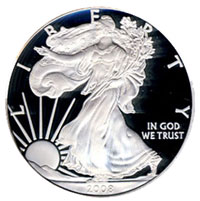
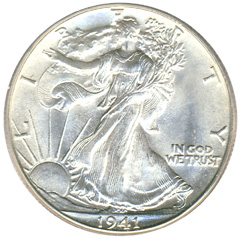
Sales of the American Eagle silver bullion coins declined for the second month in a row.  During September the U.S. Mint sold 3,013,000 silver coins, down 7.4% from last year and down 16.9% from August.

Despite the soft sales in September, demand for the silver bullion coins has been robust this year.  If sales continue at the 3 million coins per month rate through year end, 2013 will turn out to be a record sales year with annual estimated silver bullion coin sales of 45 million.

Sales of the American Eagle silver bullion coins by year are shown below.  The 2013 sales total is through September 30.


Can I Buy Gold In My IRA Account?

tenth oz gold-eaglesThe “I won’t buy an umbrella until it rains” crowd has been dumping gold while the case for ownership of  safe haven gold has never been stronger.

As the credit bubble continues to grow at an alarming pace it’s not a question of if but rather when the next financial crisis engulfs the entire world.  Gold has been used forever as the only form of sound money since it has no credit risk or counter party.

Here’s a neat info-graphic from American Bullion that nicely sums up the compelling case for allocating part of a portfolio to gold.

Gold IRA Infographic

Physical Gold Bar and Coin Sales Soar 78% To All Time High

1988-olympic-gold
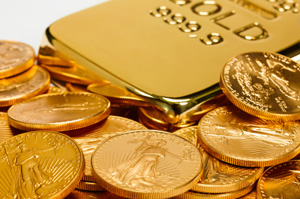
Purchases of physical gold have been hitting new all time records.  Demand has been fueled by the recent pullback in gold prices and the massive amount of money printing being conducted by central banks in Europe, Japan and the United States.  The recent decision by the Federal Reserve to postpone any curtailment of its $85 billion per month of money printing could mark the end of the correction in gold and silver.  The Fed’s refusal to reduce the ongoing program of securities purchases signals that QE has morphed from an emergency measure to a permanent Fed policy.

The demand for gold has been particularly intense in Asia as Thai Gold Buyer Doubles Imports After Bear Slump.

YLG Bullion International, Thailand’s biggest domestic gold importer, expects to more than double purchases this year after the bear market in prices spurred a surge in demand for physical metal.

The company may import as much as 200 metric tons in 2013, from 92 tons last year, Chief Executive Officer Pawan Nawawattanasub said in an interview yesterday. First-half shipments advanced to 112 tons, accounting for 60 percent of the country’s total, she said. A ton is valued at $42.6 million.

Gold tumbled 21 percent this year, heading for the first annual retreat since 2000, as some investors lost faith in the metal as a store of wealth. With prices now 32 percent below the record reached in September 2011, the rout is boosting demand for bullion bars and coins, global sales of which surged 78 percent to an all-time high in the second quarter, according to the London-based World Gold Council.

“Cheaper prices are attracting customers to buy bullion bars as they see it as money better spent than on something like a Hermes bag,” said Pawan, whose Bangkok-based company supplies retailers and investors in Southeast Asia’s second-biggest economy. “Demand in Thailand can continue to grow, partly because collecting gold is in our culture.”

Golden Buddha of Bangkok, World’s Largest Gold Statue -estimated gold value $250 million

Gold demand in Thailand is exceeded only by China and India.  Total gold demand in China and India in the form of jewelry, bars and coins is expected to reach 1,000 tons this year and gold demand in Thailand should reach 200 tons.  Total Asian gold demand from China, India and Thailand could amount to half of total world gold production of approximately 2,400 tons in 2013.

Even more astonishing is the fact that the entire world’s production of gold this year will be purchased by only three sources.  According to King World News, total gold buying by central banks, China and India is “almost equivalent to the annualized gold production of the entire world.”  It is only  a matter of time before a shortage of physical gold based on huge demand results in significantly higher prices.

Silver Soars On Strong Physical Demand and Bargain Prices

proof-silver-eagle3There is no denying that it has been a really tough year for silver investors with silver dropping from $32.23 in January to a yearly low of $18.61 in June.  Is the silver price correction finally over?  The ridiculously low price of silver has resulted in a strong surge of demand worldwide and the price of silver has soared by 23% since the June low.

No one knows if the three year bear market in silver is finally over but investors seem to have made up their minds that the current price of silver is at give away levels.  The World Gold Council reported last week that bar and coin purchases rose to record levels last quarter.  Silver demand in India and China remains very strong and U.S. investors have been buying American Eagle silver bullion coins at a record pace.

Sales by the U.S. Mint of the American Eagle silver bullion coin may hit an all time record this year based on year to date sales data.  The all time record year for sales of the silver bullion coins was in 2011 when the Mint sold almost 40 million one ounce coins.

Sales of the silver bullion coins since 2000 are shown below with sales for 2013 as of July 31st.

American Silver Eagle Bullion Coins
YEAR OUNCES SOLD
2000    9,133,000
2001    8,827,500
2002   10,475,500
2003    9,153,500
2004    9,617,000
2005   8,405,000
2006   10,021,000
2007    9,887,000
2008   19,583,500
2009   28,766,500
2010   34,662,500
2011   39,868,500
2012   33,742,500
2013   29,450,000

TOTAL 261,593,000

With sales of almost 30 million coins through July, annualized sales based on monthly sales to date would result in a record smashing year with investors purchasing over 50 million American Eagle silver bullion coins.  With governments worldwide printing money to prop up a financial system overwhelmed by debt it’s probably a very safe bet that the price of silver will continue to increase in price.

Since 2000 investors have bought over a quarter of a billion silver eagle bullion coins with a current estimated value of over $5.7 billion.  The U.S. Mint American Eagle bullion coin program has been one of the most successful mint products ever produced.

US Mint Gold and Silver Bullion Sales Soar In April

geThe exploding demand for physical gold and silver has become a worldwide phenomenon.  Shortly after the price plunge of early April buyers rushed in to take advantage of bargain prices.  Dealers and mints worldwide have reported off the charts demand for physical gold and silver.

Intense demand across Asia has resulted in shortages of gold and silver in both India and China as dealers struggle to keep up.  Singapore’s largest supplier of coins and bars reports depleted stocks of silver and long delivery delays.

The surge in physical demand is also rapidly depleting U.S. gold inventories according to Reuters.

Physical gold held at CME Group’s Comex warehouses in New York have dropped to a near-five year low in a further sign that gold’s price crash unleashed a frenzy of demand as investors scramble to buy bars and coins.

U.S. gold stocks, comprised of 100-troy ounce COMEX gold bars, have fallen almost 30 percent since February, as dealers have switched to selling into the burgeoning Asian market, where prices and demand are higher than in New York.

But the pace of the outflows from vaults has accelerated since bullion’s historic sell-off, falling more than 7 percent last week for its biggest weekly drop since 2005.

The latest sales figures from the U.S. Mint for April are further confirmation of  the voracious demand for physical gold and silver.  Sales of both the America Eagle gold and silver bullion coins skyrocketed in April.

According to the US Mint, sales of the American Eagle gold bullion coin totaled 209,500 ounces in April, up a stunning 948% from the previous year and up 22% from the previous month.  The gold bullion coins had the largest amount of sales since December 2009 when 231,500 ounces were sold.

Gold and silver bullion coin sales have soared since the financial crash of 2008 and the subsequent repetitive use of the print button by the world’s central banks.  In order to get a perspective on the flight to precious metals, consider that over the entire year of 2007, the US Mint sold a total of only 198,500 ounces of gold bullion coins – less than montly sales during April 2013.

Sales of the American Eagle silver bullion coins were also very strong.  During April 2013, the US Mint sold 4,087,000 silver bullion coins, up 169% over April of last year and up 22% from the previous month’s sales.  The US Mint has struggled to keep up with demand even before the April surge.  Sales of the American silver eagles was recently suspended twice and in late April the US Mint suspended sales of the one-tenth ounce American eagle gold bullion coin due to inventory depletion.

Based on sales to date, it would not be surprising to see an all time record high amount of the American Eagle silver bullion coins sold in 2013.


The Gold Crash – Why It Doesn’t Matter

Physical-GoldBy:  GE Christenson

The NASDAQ 100 index peaked at 1,485 in July 1998. It subsequently crashed to below 1,070 in October 1998, a loss of about 28%. But, it climbed back to nearly 5,000 in March 2000, a rally off the low of over 350% in 17 months.

The S&P 500 index peaked in October 2007 around 1,575. It subsequently crashed below 670 in March 2009, a loss of about 57%. But, it climbed back to nearly 1,600 in April 2013, a rally off the low of over 135% in 49 months.

Gold was priced at nearly $200 in January 1975. It subsequently crashed to about $100 in August 1976, a loss of about 50%. But, it climbed back to over $850 in January 1980, a rally off the low of over 750% in 41 months.

Crude oil peaked at over $147 in July 2008. It subsequently crashed to under $36 in December 2008, a loss of about 75%. But, crude climbed back to over $114 in May 2011, a rally off the low of over 210% in 29 months.

Natural gas exceeded $15 in December 2005. It subsequently crashed to under $5.50 in September 2006, a loss of over 64%. But, natural gas climbed back to over $13 in July 2008, a rally off the low of over 130% in 22 months.

Gold was priced at about $1,920 in August 2011. It subsequently crashed to about $1,350 in April 2013, a loss of about 30%. Gold will probably climb back to a large number in the relatively near future, a rally off the low that will be really impressive.

Silver climbed to over $48 in April 2011. It subsequently crashed to under $23 in April 2013, a loss of over 52%. Silver will probably climb back to a very large number in the relatively near future, a rally off the low that will be quite impressive.

Markets rally, correct, rally, and correct again. Some of the corrections are so severe we call them crashes. In the big picture, it hardly matters whether the crashes were accidental, encouraged, manufactured, or all three. In the big picture, what matters are the market fundamentals. After the correction, have the fundamental drivers of the market changed?

Important Questions for Gold & Silver Investors

    • Are the central banks of the world still rapidly expanding the money supply?
    • Are the derivatives and currencies bubbles in danger of crashing?
    • Are governments still spending much more than their revenues?
    • Are central banks, governments, and wealthy individuals continuing to buy gold?
    • Is total debt rapidly increasing?
    • Is consumer demand for gold and silver increasing?
    • Is faith in unbacked paper money decreasing?
    • Are faith and trust in banks and politicians decreasing?
    • Does the financial world appear to be more dangerous and unstable each year?
    • Are the above imbalances unlikely to improve in the next few years?

If YOUR answer to most of the above questions is “yes,” then regarding YOUR big picture perspective, gold and silver are probably very good investments, in addition to being valuable insurance in case some or all of the above imbalances do NOT resolve favorably and safely. Yes, this is likely to end badly.

The recent crash in silver and gold was one of many for the record books. But, gold is not the same as Enron stock. Tangible physical metals that have been a store of value for over 3,000 years are not the same as a paper promise made by less than reputable individuals and organizations. In the world today, it seems there are many disreputable individuals, corporations, and governments, all pushing paper. We have been warned!

History suggests we should side with 3,000 years of history during which gold and silver have been a store of value and the ultimate real money. History suggests that we should not trust our savings with either the paper pushers or their unbacked paper money.

For silver and gold investors, there are 3,000 years of history supporting your viewpoint and your commitment. There have been many rallies and crashes in both markets; but, even at their recent crash lows, the price of both is over five times higher than their lows in 2001. New highs will occur. Don’t let the paper pushers frighten you out of your investments.

GE Christenson
aka Deviant Investor

Worldwide Buying Frenzy of Gold and Silver Continues

Liberty EagleDon’t precious metal investors read newspapers?  Despite proclamations from the mainstream press that the bull market in gold and silver is over, a buying frenzy in precious metals is occurring worldwide.  The gold rush mentality to buy gold and silver at bargain prices has resulted in stock out conditions for many retail sellers of precious metals, including the U.S. Mint.

Intense gold demand in India has lead to shortages as Gold Buyers Throng Indian Stores for Second Week on Rally.

Gold consumers in India, the world’s biggest importer, thronged jewelry stores across the country for a second week on speculation that bullion may extend a rally after the biggest plunge in three decades.

“We waited for sometime to see if prices will fall more but when we saw them moving up again, we decided it’s time,” said Sripal Jain, a 77-year-old silver dealer who came with his younger brother, daughter and daughter-in-law to buy gold necklaces at Mumbai’s Zaveri Bazaar. “We don’t have any wedding or occasion coming up. The rates fell, so we decided to buy.”

Bullion slumped 14 percent in two days, reaching the lowest price in two years on April 16, triggering a frenzy among coin and jewelry buyers from the U.S. to India, China and Australia. The surge in demand has helped prices rally 11 percent since April 16, and jewelers in India are paying premiums of as much as $10 an ounce to secure supplies, according to the Bombay Bullion Association.

Gold will rally to $1,800 an ounce by December as skepticism over the global recovery increases demand, billionaire Indian jeweler T.S. Kalyanaraman said on April 19.

The rush to buy has led to a shortage in India and jewelers are paying premium of as much as $10 an ounce compared with $2 just 10 days earlier, said Bipin Jain, owner of Vimalson Jewellers and a vice president of the bullion association.

The Perth Mint reports that while the media is talking about the bear market in gold, bullion buying has soared as bargain hunters move in.  As gold and silver prices corrected, Perth Mint buyers viewed the situation as a perfect buying opportunity and stepped up their purchases of gold and silver.  Activity on the Perth Mint website was so intense, that some buyers experienced long delays.

As the central bank of Japan continues its unprecedented experiment in massive monetary expansion, the Japanese Seek Refuge in Bullion as Yen Slumps, Inflation Looms.

Japanese consumers are poised to become net buyers of gold for the first time in eight years as the yen’s decline and looming inflation drive them to seek refuge in bullion, according to Standard Bank Plc.

Net sales of gold bars and coins by Japanese individuals shrank to 10.1 metric tons in 2012, the smallest amount since 2005, data from the World Gold Council show. A surge in purchases this month and the chance to buy after bullion slumped into a bear market foreshadow a turnaround in 2013, said Bruce Ikemizu, Standard Bank’s head of commodities trading in Tokyo.

The currency has depreciated 13 percent against the dollar this year and is trading near a four-year low after the central bank’s pursuit of unprecedented monetary easing to end deflation was unopposed by Group of 20 nations. Inflation may rise above 1 percent in the 12 months starting April 2014 and approach a 2 percent target as early as that year, Bank of Japan (8301) policy board member Ryuzo Miyao said April 18.

“The time has come for Japanese to buy gold with the government trying to engineer inflation,” Ikemizu, who has traded commodities for almost three decades, said in an interview in Tokyo yesterday. “Retail investors are turning from sellers to buyers of bullion.”

In India and China, the biggest gold-consuming nations, shoppers last week lined up in bazaars from Mumbai to Shanghai to buy the metal for brides, babies and strongboxes after prices fell. Indian consumers bought a net 312.2 tons of gold bars and coins in 2012, while purchases by individuals in China reached 265.5 tons, according to the World Gold Council.

The long term rationale for owning gold and silver remains intact.  The reasons for the recent smash-down in gold and silver may never be known but it has provided a gift opportunity to increase positions in gold and silver.

U.S. Mint Runs Out of Gold Bullion Coins

tenth oz gold-eaglesWe already knew from numerous previous reports that demand for physical gold and silver has soared since the early April precious metals crash.  Further confirmation of vanishing physical gold and silver inventory was provided today by the Untied States Mint.  Authorized purchasers of gold and silver bullion coins were informed by the U.S. Mint that sales of the one-tenth ounce American Eagle bullion coin would be immediately suspended due to depleted inventories of the coin.

As short term paper speculators run from the precious metals markets, long term investors have been lining up around the block to buy physical gold and silver.  Numerous coin and bullion dealers have reported growing shortages of gold and silver and premiums have expanded as demand overwhelms supply.

Based on mid month sales reports for the American Eagle gold bullion coins, it looked like monthly sales would exceed 167,000 ounces, the highest since December 2009 when the financial system was still in a meltdown.  As of today, U.S. Mint sales of gold bullion coins has reached 183,500 ounces, an astonishing increase of 818% over the prior year’s monthly sales of 20,000 ounces.  April sales to date have increased by 196% over March sales.  For all of 2012, average monthly sales of the American Eagle gold bullion coin were 62,750 ounces.  Gold bullion coin sales by the U.S. Mint are shown below; figures for 2013 are through April 23rd.


Gold Bullion U.S. Mint Sales Since 2000
Year Total Ounces Sold
2000 164,500
2001 325,000
2002 315,000
2003 484,500
2004 536,000
2005 449,000
2006 261,000
2007 198,500
2008 860,500
2009 1,435,000
2010 1,220,500
2011 1,000,000
2012 753,000
2013 476,000
TOTAL                                      8,478,500

Sales of the American Eagle silver bullion coins, which had already been selling briskly before the April silver smash-down, continue to sell at a rapid pace.  Total monthly sales as of April 23rd have reached 3,232,000 ounces, almost as much as the previous month’s total and 112.6% higher than the comparable month of 2012.

The steep correction in gold and silver prices that occurred in early April has certainly not disturbed the fundamental long term reasons for buying precious metals.  Expect the buying stampede to continue.

Physical Demand For Gold and Silver Skyrockets – Gold Bullion Coin Sales Highest Since December 2009

1881-CC-Morgan-DollarWe have probably all heard enough already from the mainstream nitwits who are forecasting the end of the gold bull market and further price declines.  Funny thing though, most precious metal investors don’t need advice from self proclaimed experts on how to invest their money.  The explicitly stated goal of central banks to increase the rate of inflation through currency debasement is blatantly obvious.  Investors are acting accordingly by taking advantage of the recent decline in precious metal prices.

A look at product availability and pricing at some major coin and bullion dealers shows spot shortages of gold and silver as well as large premiums as investor demand overwhelms supply.

The Perth Mint reports that retail customers are increasing purchases at a record rate even as gold slumps to a 21 month low.  As the experts were proclaiming the “Death of Gold”, the Perth Mint website recorded the highest activity of the year and one of the best days of the past year.  Bargain prices on gold and silver have greatly increased the demand for physical gold and silver by the public.  Demand for gold coins have skyrocketed with sales of Australian gold bullion coins increasing by 48% in the first quarter over the comparable prior year period.

2013-Australian-Kangaroo-1oz-Gold-Bullion-Coin-Reverse-S

Buying by U.S. investors of the American Eagle gold and silver bullion coins has also increased dramatically.  Through April 16th, sales by the U.S. Mint of the American Eagle gold bullion coins have already exceeded total monthly sales for the previous two months.  At the current sales pace, sales of the gold bullion coins in April will total over 167,000 ounces, an increase of over 260% from the prior month.  The last time sales of gold bullion coins exceeded 167,000 ounces was in December 2009 when the U.S. Mint sold 231,500 ounces.

Sales of the American Eagle silver bullion coins are also strong in April, continuing a trend that began with the financial crisis in 2008.  Sales of the silver bullion coins through April 16th total 2.2 million ounces.  If the current sales pace continues through the end of April total sales of the Silver Eagle coins will increase by 31% over the previous month.

Short term speculators may be crashing the precious metals markets, but long term investors in gold and silver see this as the ultimate golden opportunity to increase positions.


Why The Long Term Price of Silver Is Guaranteed To Rise

By: GE Christenson

Walking-Liberty-HalfBegin the analysis in 1971 when Nixon dropped the link between the dollar and gold. A pack of Marlboros cost (depending on local taxes) about $0.39. We paid about $0.36 for a gallon of gasoline. The DOW Index was about 850. Silver was priced at about $1.39.

Times have changed! Read Part 1 of Silver – Keep It Simple!

Today we have more currency in circulation, far more debt, and much higher prices – what does it mean?

Examine Graph 1. The prices for retail cigarettes, crude oil, national debt, silver, and the true money supply (TMS) (see notes at end) are shown on a log scale graph with all prices normalized to start at 1.0 in 1971.

Click on image to enlarge.
  • National debt (green line) has increased rapidly since 1971 and even more rapidly, on average, than the other items. (National debt has increased over 12% per year for the last five years.)
  • Silver (black line) and crude oil (red line) prices have been erratic with peaks in the early 1980s, troughs in the late 1990s, and substantial rises since 2001.
  • Cigarettes and TMS have increased steadily since 1971.
  • TMS (also M2, M3, etc.), debt, and most commodity prices have increased exponentially since 1971. Because the dollar was not backed by gold, dollar creation, total debt, and prices increased rapidly.
  • Not shown are some prices that increased more rapidly (medical costs and college tuition) and some that increased more slowly (postage and bread).

Graph 2 shows annual silver and crude prices smoothed with a centered five period moving average. This removes much of the “noise” in the price data and shows longer term trends better. Note that the price of silver actually reached about $50 per ounce in early 1980, but the average daily price in 1980 was only $16.39; the smoothed daily average was about $11.

Click on image to enlarge.

Statistical Correlations

  • Silver prices in dollars (annual average of daily price) correlated with crude prices in dollars (annual average of daily price) at 0.83 – a good correlation. Both are commodities, both are affected by politics, and both are sensitive to money supply, actual inflation, and inflationary expectations.
  • TMS correlated with national debt at 0.99 – a tight correlation. When budget deficits increase the national debt, the money supply expands accordingly.
  • Silver prices (annual average shown) correlated with national debt at 0.67 and with TMS at 0.58. The smoothed silver price correlation to national debt was 0.76 over 40 years and much higher over the past 13 years.
  • Silver prices (smoothed) correlated with crude prices (smoothed) at 0.93 – an excellent correlation.

So What?

  • National debt correlates tightly with TMS. Smoothed silver prices correlate well with both national debt and TMS. We may be apprehensive about future silver prices, but we can be 99.99% certain about the inevitable increase in national debt. Based on the 40 year correlation between silver and national debt, silver prices will continue to rise.
  • Both crude oil and silver are commodities that experience large price volatility. On average, they go up and down together; and, over a 40 year history, their prices have clearly moved substantially higher. I see many reasons to expect both to move higher in the long term.
  • Crude oil is the most important commodity in the world. Its per capita use, on average, is rising and the world’s population is increasing, so demand will remain strong, unless the world suffers a massive financial and economic collapse. Further, the easily available oil has been taken so there is little chance that inexpensive supply will increase. More demand coupled with flat or declining supply requires higher future prices. Higher crude oil prices strongly suggest higher silver prices.
  • Central banks are “printing money” in their desperate attempt to fight deflation, levitate asset prices, bailout banks and countries, and encourage inflation. This guarantees further increases in national debt and TMS and price increases for most commodities including crude oil, cigarettes, and silver.

Price of Silver as a Projection Based on Other Variables

We can construct a calculated price for silver based on three variables – national debt, TMS, and the price of crude oil. Examine Graph 3 of smoothed silver prices and the calculated price of silver based on those three variables. Note that the correlation is 0.86 – quite good. The silver price has both a monetary component (national debt and TMS) and a commodity component (crude oil). Together they produce a simple but effective projection for the smoothed average price of silver over the past 42 years.

Click on image to enlarge.

For the Future

Assume national debt increases 12% per year for the next five years like it has for the past five years. Assume TMS and crude continue their past five year growth rates (11% and 8%). The estimated price for the smoothed average price of silver is about $55 in 2016. The peak price on a spike higher could easily be triple the smoothed price. Look for $100 silver in 2015 – 2017 unless a deflationary collapse occurs – to the detriment of everyone including banks, politicians, and national governments.

Conclusion

Debt, money supply, and the prices for most commodities have exponentially increased over the past 42 years. Prices for crude oil and silver have substantially increased but inconsistently. I can be certain of death and taxes, and I feel confident that the national debt and prices for crude oil, cigarettes, silver, and most other consumer items will drastically increase in the next few years – under circumstances similar to the past 40 years. A hyperinflationary increase is also possible, in which case, all commodity prices will be unbelievably higher. Assuming no deflationary collapse, expect $100 silver relatively soon – perhaps in 2016. Read Past & Future Speculative Bubbles – What They Indicate for Gold and Silver!

GE Christenson
aka Deviant Investor