March 28, 2024

An Audit of U.S. Gold Holdings Last Done Over 50 Years Ago

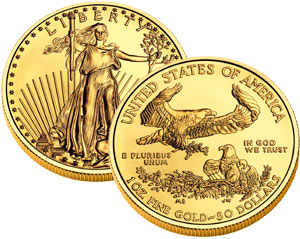
Fort KnoxDoes anyone really think that gold is unencumbered, unleased, and actually physically there? Yes, I know…

  • They would not lie to us, right?
  • The official numbers must be true, right?
  • They seem like trustworthy people, right?
  • Why wouldn’t it be there?

The official gold holdings ( rounded numbers) of the US Treasury Department are as follows:

Fort Knox 147,000,000 ounces, West Point 54,000,000 ounces, Denver 44,000,000 ounces, Federal Reserve of NY 13,000,000 ounces, other 3,000,000 ounces –  Total – 261,000 ounces.

Glad you asked that question. Why wouldn’t it be there? Gold is a bit like an “anti-dollar.” The Federal Reserve creates new dollars by the trillions – dollars are their product. Wal-Mart sells snow shovels and a few other things, Wall Street sells stocks and everything paper, Hollywood sells dreams and entertainment, but the Fed sells dollars, and they don’t like competition. Gold has been real money for 5,000 years world-wide. Federal Reserve notes have been passed off as money for a few decades, and in that time they have lost most of their value as measured against commodities such as wheat, gasoline, and cigarettes.

It could have been worse! Western central banks (officially) and governments sold a considerable sum of gold during the 1990s to help repress the price of gold and to slow the apparent decline in the value of paper money. They also “leased” an unknown amount of gold to bullion banks who also sold that gold into the market. The leases are still “on the books,” so the central banks officially still own the gold, even though it is probably long gone – likely to China, Russia, India, and the Middle East.

Yes, central banks and governments have motive, means and opportunity to suppress the price of gold. They want to support their product (dollars, euros, etc.) and to defeat the competition – gold. If you were a central banker or treasury official who was inflating his currency and consequently reducing its purchasing power, wouldn’t you want to suppress the price of gold to delay recognition of your involvement in the devaluation process?

So why not just do an audit? This is a simple question with a complex set of answers. Here are a few.

    • The US gold has not been audited in over 50 years. This must seem strange to any thinking person, but it appears unlikely to change.
    • If the Treasury agrees to an audit and the gold is not there, the result will be much unpleasantness – possible indictments, damaged reputations, social unrest, chaos, disillusionment, and destroyed trust – and there is plenty of disillusionment and destroyed trust already.
    • If the Treasury performs an audit and the audit claims the gold is actually there, will anyone believe the results of the audit? Is it truly unencumbered – not sold, leased, or hypothecated? Would we even believe an audit had been actually performed?
    • If the Treasury acknowledges the lack of a credible audit for over 50 years and then says “we don’t think it is necessary,” will anyone take them seriously?
    • The Treasury might claim an audit would be too expensive, but the US government probably wastes the cost of an audit every few hours, so that explanation is likely to sound hollow and stupid.Bottom line: The whole subject of an audit is fraught with potential trouble for both the Treasury and the Fed. The simple solution is to stonewall the audit question and “extend and pretend.”

The problem is that the questions just won’t die. GATA has researched the subject thoroughly and suggests that much of the Treasury gold is probably gone. Eric Sprott has examined the export numbers (official US government export data) and concluded that somehow the US exported about 4,500 tons of gold more than can reasonably be accounted for.

Germany asked for their gold back – a measly 300 tons – and was told it would take seven years to return their gold. It the gold was physically in the vault and unencumbered, it should have taken a few weeks at most. Seven years – really? This must seem strange to any thinking person.

From Bill Holter: “I would like to address the biggest (in my mind) conspiracy theory (fact) of all. It has been “said” for nearly 60 years that the U.S. has 8,400 tons of gold left. First off, there has been no audit done since 1956, not even Senators or Representatives (except for one time in the ’70?s for glance) have been allowed to actually see the gold. “Trust us” is what the population has heard, “trust us” is what foreigners are told…trust us, trust us, trust us. The problem is that so much anecdotal evidence has been dug up by GATA and others. Eric Sprott just last month looked at the U.S. gold export numbers going back 10 years or more and found that 4,500 tons OVER AND ABOVE what are reported as production has been shipped out. Where did that gold come from? When looked at with your 3rd grade mind in gear, there is no way that the gold is really there.

… Forget about all of the past official memos uncovered. Forget all of the evidence that GATA has uncovered over the last 15 years. Forget that Germany asked for their gold and were told “wait 7 years.” Forget that gold and silver prices have not acted like any other market since the mid 90′s and those prices have now crashed 3 times in the face of massive demand. Forget that 2 of the smash downs occurred WHILE the CFTC was supposedly “investigating” the silver market. Forget that 40% of the world’s total gold production was sold in reckless fashion in less than 12 trading hours (who would, could, do this?) FORGET IT ALL! …trust us. … All of this “conspiracy stuff” when put together rather than separately makes sense.”

I don’t know how much gold is left, but I have two (only slightly serious) suggestions:

A very large number of readers on the Deviant Investor site have voted over the past several months regarding what % of the gold they think remains in the US Treasury. The choices were all of it, most of it (>75%), about half (40% to 75%), some (20% – 40%) or very little (<20%). Readers clearly do not believe the official story – about 60% believe very little remains and another 21% believe less than 40% remains. Only 3% think it is all there. A weighted average suggests that the voters on this site believe approximately 20% of the gold physically remains and is unencumbered.

Nixon temporarily closed the “gold window” almost 42 years ago. Since that time, the official CPI shows that the dollar has lost about 83% of its value. For simplicity, let’s assume that 17% of the dollar’s purchasing power remains and assume that 17% of the gold remains.

We don’t know how much of the gold remains. Does it really matter?

Do any of the following matter?

  • Government promises
  • Central bank promises
  • Integrity of politicians
  • Integrity of hundreds of present and past Treasury employees
  • Backing for $Trillions in debt besides “full faith and credit”
  • A possible solution to the massive debt problem of the US government. If the gold is still there, value it at some large number, say $15,000 – $30,000 per ounce, and then back the dollar with gold. This is not my idea – some very intelligent people have advocated it. If the gold is mostly gone, this option is less likely.

Summary

  • Fort Knox: Per the voting and dollar devaluation “method” – assume about 20% of the official gold remains – physically in the vaults, unencumbered, not hypothecated or leased to bullion banks. Yes, I know, this is not defensible, scientific, statistically significant, or verifiable. But it sounds about right to me.
  • Denver: Assume about the same
  • West Point: Assume about the same
  • Federal Reserve Bank of New York: Ask the Germans! Assume very little remains.

How much physical gold do you have? How much do you want when you contemplate nearly $17,000,000,000,000 in official US government debt, another $100 – $200 Trillion in unfunded liabilities, and nothing backing that unbelievable amount of debt except the “full faith and credit” of what is clearly a government that won’t balance a budget and must resort to printing dollars to pay its bills?

How much gold do you have stored in a secure (off-site) facility?

GE Christenson
aka Deviant Investor
Gold and Silver Investors Need to Ask Themselves 10 Basic Questions

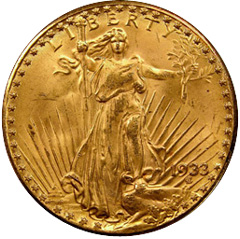
1933-double-eagle1Rick Rule listed 10 key questions regarding today’s economy. They are:

10 Questions for Precious Metals Investors

  • Is the financial crisis in the Western world over?
  • Have the G20 countries balanced their budget?
  • Did the commercial banks manage to become solvent?
  • Are (real) interest rates positive or negative?
  • Is a global competitive devaluation to increase exports still ongoing?
  • Is the European periphery still financially challenged?
  • Do the Asian countries still have a cultural affinity with precious metals?
  • Which are the US budgetary issues and solutions?
  • Are the derivatives from large banks still a problem for economies and client portfolios?
  • Can liquidity solve the issue of insolvency?

If these are the questions, then gold and silver are two good answers.

But, let’s approach these questions from a different direction.

  • Have gold or silver ever defaulted?
  • Do gold or silver have counter-party risk like EVERY paper investment?
  • On January 1, 2000 the Dow was about 11,500, gold was priced at $289, and silver was priced at $5.41. As of May 24, 2013, those numbers were: Dow: 15,303, gold $1,386, silver $22.49. Which was the best investment?
  • Gold fell (in 21 months) from over $1,900 to about $1,320. Does that mean the gold bull market is over? The Dow crashed from 14,100 (October 2007) to about 6,500 (March 2009), and then rallied back to new highs. Don’t exclude the possibility of new highs for gold and silver in the coming months.
  • Why are Chinese businesses, individuals, and their central bank buying gold as rapidly as possible? Why does the Chinese government refuse to allow any gold to be exported? Why does China (world’s largest gold producer) additionally import a massive amount of gold every year?
  • Ask the same for Russia, India, and much of Asia. What do they know about the VALUE of gold that the EU and the USA (who are selling gold) don’t understand?

Further:

  • Gold and silver have gone up and down, when priced in unbacked paper currencies. The same is true for trucks, diamonds, the Dow Index, laundry detergent, gasoline, cigarettes, and wheat. Price increases and volatility will continue.
  • Gold, silver, and the national debt have increased exponentially since Nixon severed the link between the dollar and gold in 1971. All three will continue to rise. Gold and silver will occasionally rally too far and crash, while the national debt will increase until politicians no longer enjoy spending other people’s money.
  • Goldman Sachs (and many others) have said gold is in a bubble. The same individuals and groups probably did not see the bubble in Internet stocks and housing. Do you trust them or the 3,000 years of history during which gold and silver have been real money and a store of value?
  • If JP Morgan (and others) can make huge profits using computers, complex mathematical algorithms, and High-Frequency-Trading, then they will. Often their trading temporarily drives the prices for gold and silver down. After the markets have been driven far enough down, the same trading process is used to drive the prices higher. Expect it!
  • Silver has dropped from about $49 (April 2011) to just above $20 (May 2013) – almost a 60% drop in price. Does that mean it will continue to drop more – perhaps to $10? Silver has retained its value, on average, for 3,000 years but has fallen in price for two years. On the basis of price action in those two years, most individuals (based on sentiment measures) have chosen to trust unbacked paper currencies issued by an insolvent central bank and an insolvent sovereign government instead of silver. This is typical of market bottoms, even if it is not sensible.
  • About 4.5 years ago (October 2008) silver crashed to a price bottom where “everybody felt” like it was hopeless to expect silver to rally again. About 4.5 years before that (May 2004), silver also crashed to a price bottom where “everybody felt” like it was hopeless to expect silver to rally again. But, in fact, the silver rally off the low in 2008 was over 450%, and the rally off the 2004 low was over 175%. Silver will rally again.
  • We may not trust bankers and politicians to effectively run the country, but we can trust them to “print money” and to spend in excess of their revenues. Consequently, we should trust them to drive the prices, as measured in unbacked paper currencies, for gold and silver – MUCH higher.

GE Christenson
aka Deviant Investor

Will the Fed’s “Grand Experiment” To Reignite The Economy With Unprecedented Monetary Accomodation Result in Economic Chaos?

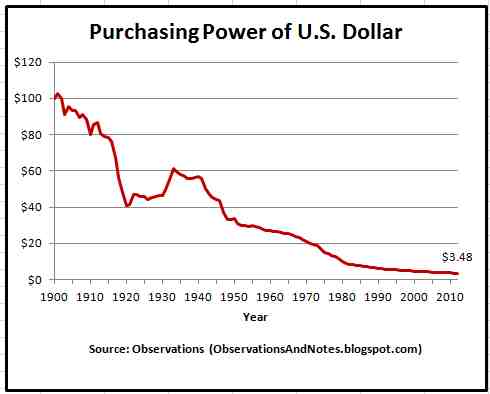
Purchasing Power of U.S. DollarRichard W. Fisher, president and CEO of the Federal Reserve Bank of Dallas gave a very interesting speech today, acknowledging that the Federal Reserve policy’s are experimental.  No one, including the Federal Reserve, knows how this unprecedented monetary accommodation will affect the economy and the value of the dollar.

Fortunately, there is a defense to the Fed’s schemes to inflate the economy and debase the dollar.  That defense is known as gold – the only store of wealth which cannot be inflated away by profligate governments.

This is a long and rather dense speech, but well worth the read to understand just how tenuous our current economic situation is.

Current Predicament of Monetary Policy: A Grand Experiment

I’ll begin with a summary of the current predicament of monetary policy.

The Federal Reserve has undertaken a grand experiment to reignite the economy through unprecedented monetary accommodation. We cut to zero the base rate that anchors the yield curve and have pursued a policy aimed at driving rates throughout the curve to historic lows by buying Treasuries and mortgage-backed securities (MBS). Our portfolio totals about $3 trillion, which we have recently been expanding at a rate of $85 billion per month.

Here is a picture of the domestic securities of the current System Open Market Account (SOMA) portfolio. [1]


The sea change in the balance sheet in recent years is immediately visible: In sharp contrast to the past, we now hold almost no Treasury notes of less than three years’ duration—the dark blue space. We have purchased in the secondary markets some $1.7 trillion in longer-term Treasuries—the light blue area—and, as denoted by the green, more than $1.1 trillion of securities backed by the Federal National Mortgage Association (commonly known as Fannie Mae), the Federal Home Loan Mortgage Corp. (Freddie Mac) and the Government National Mortgage Association (Ginnie Mae). We live in an age of big numbers when I can say, “Ignore the purple space, for it is only $70 billion in remaining Fannie and Freddie debentures, aka ‘agency debt.’” Before the crisis, when we didn’t have any agency debt, $70 billion would have represented 8 percent of our balance sheet.

As to the duration of these purchases, here is a picture from year-end 2012:


Including securities purchased since then, the total SOMA portfolio has an average duration of seven years, with Treasury securities at eight years and MBS having risen to four years.

According to dealers’ forecasts at year-end and as of March, the probability distribution of the expected size of the SOMA portfolio is as follows:

So, you now have a snapshot of where we are. The Federal Open Market Committee (FOMC) has cut the short-term rate to zero. Being “zero bound,” we instructed our traders to embark on a buying spree of Treasuries and MBS, and they have done so, ballooning our balance sheet from its precrisis level of less than $900 billion to about $3.3 trillion. Presently, the committee is adding to its holdings at a rate of $85 billion in longer-term securities each month, in addition to reinvesting principal payments from holdings of agency MBS and agency debt securities into agency MBS. And the predominant sentiment of the “market,” as measured by our dealer surveys, presently posits that we will build our holdings further, to between $3.5 trillion and possibly $5 trillion by the end of 2014.

The Economy’s Dashboard

As to the status of the economy, here is the dashboard our Research Director (and former NABE President) Harvey Rosenblum uses as a simple graphic to describe the current economic predicament:

You will note that the data compiled at the end of the first quarter on real gross domestic product (GDP) growth and inflation—as measured by the Trimmed Mean Personal Consumption Expenditure (PCE) Index, the Dallas Fed’s preferred indicator—show that both increased less than 2 percent year over year. The dashboard also indicates that at quarter’s end, we were cruising along at near stall speed—note the “Engine stall” red warning light. The unemployment-rate gauge is not red because it declined to 7.5 percent in April. And, as indicated by the odometer box, we have traveled some distance in job creation, even though we have not seen the job creation we might have hoped for in a typical recovery: 70.4 percent of jobs lost in the recent recession have been recovered, up from about 50 percent only a year ago. The indicator for the yield curve, if anything, is robust. Junk-bond spreads are below 5 percent; nominal yields for even the lowest-grade bonds (CCC-rated credit that is one notch above default) have fallen to below 7 percent from double digits only a year ago. Further, covenant-light lending is on a tear. The “oil gauge” indicates the Fed has supplied plenty of lubrication for the engine of job creation.

Professional Forecasters Have Been Disappointed Thus Far…

Over the four years since the recession ended in June 2009, GDP growth has averaged just 2.1 percent, hewing to a narrow year-over-year range of 1.5 to 2.8 percent. It is noteworthy that the fraternity of professional economic forecasters has been consistently disappointed: Forecasts made at the beginning of 2010, 2011 and 2012 all overpredicted growth. At the onset of this year, the median forecast for 2013 called for 2.4 percent GDP growth, and that, too, has been challenged by first-quarter data that came in below expectations, raising fears of “déjà vu all over again.”

…But April Could Signal Improvement

However, the April jobs report and revisions of previous jobs data have put some spring back in economists’ steps. Initial claims for unemployment insurance are now back on a downward trend, retreating to prerecession levels, and Monday’s retail sales numbers were a nice upside surprise. This indicates that consumers may have digested delayed tax rebates and the increase in payroll taxes, and are reaping the benefits of lower gasoline and food prices. So the recovery presently appears to be strong enough to propel hopes that employment growth will continue improving over the near term.

As to Inflation…

Of course, the Fed’s most sacred duty is to see to the maintenance of price stability. Today, inflation is benign. With a jobless rate still well north of 7 percent, labor compensation rising at less than 2 percent per year, an outlook for abundant food crops and expanding energy sources, and near-record profit margins among operating businesses, there appears to be little risk that we will see significant cost-push pressures in 2013. In addition, slower growth around the globe is putting the damper on demand-pull inflation. Provided that the public remains confident in the Fed’s commitment to long-run price stability, anchored by the FOMC’s stated commitment to a target of 2 percent, my reading of the entrails of the Trimmed Mean PCE inflation rate currently indicates we will likely end this year somewhere between 1.5 percent and our 2 percent long-run goal. [2]

As a hawk in the aviary of policymakers, I have for some years now said that the issue at present is not a meaningful threat to price stability in the immediate future. The issue is job creation. And the questions I keep raising at FOMC meetings regard our ability to affect it.

Time to Reset the Fed’s Sails?

Having spent the happiest of my formative years preparing for and attending the U.S. Naval Academy, then paying my way through Harvard sailing oceangoing yachts as a hired hand, I am given to seafaring analogies. Here is how I would summarize our most recent journey:

The current chairman, Ben Bernanke, took the wheel at the Fed just as we sailed into a tempest that nearly capsized our economy. He and his able crew kept the ship of the economy from floundering and navigated it past the rocks of depression and deflation. The Bernanke-led FOMC steered clear of the shoals of economic collapse by jury-rigging the vessel of monetary policy in an unconventional and unprecedented manner. Now the ship of the Fed is in more benign waters and is sailing forward. The question before us is this: Are we moving forward at sufficient speed to allow the Fed to reset our rigging and our sails, eventually going back to a more conventional configuration?

The answer lies in the economic outlook. I am wary of giving pinpoint forecasts of economic growth. As I mentioned earlier, professional forecasters, including the very capable staff of the Federal Reserve, have fallen short on this front, time and again, during the recovery and on numerous occasions before that. I am always mindful of the memorable comments of Ken Arrow. You may recall them:

During World War II, Arrow served as a weather officer in the Army Air Corps. He and his team were charged with producing month-ahead weather forecasts. Being a disciplined analyst, Arrow reviewed the record of his predictions and, sure enough, confirmed statistically that the corps’ forecasts were no more accurate than random rolls of dice. He asked to be relieved of this futile duty. Arrow’s recollection of the response from on high was priceless: “The commanding general is well aware that the forecasts are no good. However, he needs them for planning purposes.”

With that caveat in mind, my staff and I think there is a better-than-even chance that the present GDP growth consensus forecast of 2.4 percent by professional economists may be underestimating the underlying pace of growth. The housing market is in resurgence, contributing significant impetus to the economy. The Fed’s senior loan officer surveys indicate that commercial banks are becoming more accommodative lenders, albeit remaining cautious. [3] The snapback in housing and the harnessing of cheap and abundant money by the business sector have made for more manageable financial obligations. State and local governments, not just in Texas but elsewhere in the nation, are on a better financial footing and no longer appear to be a major drag on growth. As this audience knows better than anybody, new technologies are providing for cheaper and more abundant energy. Consumers continue consuming. Monetary policy is hyper-accommodative, driving interest rates to historic lows and equity markets to historic highs; if anything, it may be giving rise to excessive speculation and risk taking. (In addition to the pricing of CCC debt and the surge in low-covenant lending, margin debt is climbing rapidly.)

I have advocated that we begin to reef in the sails, beginning with our MBS purchase program. In my view, the housing market is on a self-sustaining path and does not need the same impetus we have been giving it. In recent months, under its balance-sheet expansion program, the Fed has bought about 50 percent of gross issuance of agency MBS, partly to replace prepayments of our MBS holdings. When refinancing activity eventually shifts down, the Fed could soon be buying up to 100 percent of MBS issuance if the current purchase program continues. I believe buying such a high share of gross issuance in any security is not only excessive, but also potentially disruptive to the proper functioning of the MBS market. I have never been comfortable with our investing in anything but Treasuries, being wary of a central bank engaging in credit allocation and favoring specific sectors of the economy. It brings to mind the fears Thomas Jefferson and James Madison had about the slippery slope of Alexander Hamilton’s First Bank of the United States, recently recalled in Jon Meacham’s brilliant book on Jefferson: “They feared that the Hamiltonian program would enable financial speculators to benefit from commercial transactions made possible by government funds.”[4]

Yet I admit that given the crucial role housing plays in our economy and the dire straits the housing market was in at the time, I did hold my nose and vote for the first tranche of MBS purchases. I believe that initiative was helpful in jump-starting the housing market. But now I believe the efficacy of continued purchases is questionable. And I consider holding $1.1 trillion and counting of MBS as a possible impairment to our ability to maneuver our balance sheet with the nimbleness and alacrity we might need. I think we can rightly declare victory on the housing front and reef in (or dial back) our purchases, with the aim of eliminating them entirely as the year wears on.

Enter Fiscal Policy. Oy!

Even if we at the Dallas Fed are right and the overall outlook for the economy is better than the current dashboard or the conventional prognostications of economists, there exists a formidable brake on growth. It was referred to point-blank in the last statement issued by the FOMC: “…fiscal policy is restraining economic growth.”[5]

Fiscal policy is inhibiting the transmission of monetary policy into robust job creation.

As it is early in the morning and a little levity is always helpful in making a point, here is my favorite spoof on the historical behavior of fiscal policy makers:

This would be funny if it were not so sad. The propensity of members of Congress has been to spend in excess of revenues to give pleasure to their constituents and garner their affection. They just didn’t get the memo that Jefferson wrote to Madison:“We are ruined, Sir, if we do not overrule the principles that ‘the more we owe, the more prosperous we shall be,’ [and] ‘that a public debt furnishes the means of enterprise.’” [6] The good news is that, some 200-plus years later, the memo seems to have finally been received; there are numerous plans to rein in Congress’ spendthrift ways and there have been improvements that have brightened the short-term outlook for the level of federal debt. [7] But, as yet, there has been little more than passive action. Until the Congress and the president provide a clear road map as to how fiscal rectitude will be implemented, this lack of credible details for limiting the debt-to-GDP ratio and reengineering fiscal policy to stimulate rather than constrain growth is creating undue uncertainty about future tax rates, future government purchases, future retiree benefits and all manner of factors that impact employment and economic growth. Meanwhile, the divisive nature and petty posturing of those who must determine the fiscal path of the nation is further undermining confidence and limiting the effectiveness of monetary policy.

Here is the rub: Even if the arguments of those who wish for greater fiscal stimulus prevail, expansion in government purchases will have reduced effectiveness if it is thought that those purchases will be financed with higher future marginal tax rates. If you are an operating business, you have to discount this risk before adding significantly to payrolls and before undertaking capital expansion. In a similar vein, you need to consider how the opposite approach of cutting government expenditures might impact your top line if the cuts are in areas that affect the markets you sell into. Add to that the enormous uncertainty about how health care reform will impact your cost structure. And add to that the fact that community bankers—providers of the lifeblood of loans to small businesses, which are the impetus for new job creation and economic rejuvenation—are hamstrung by burdensome regulations and fees imposed in response to the misbehavior of their too-big-to-fail brethren. If you consider the economy from this perspective, you can see where brakes of our own government’s making are being applied to a realization of our growth potential.

Decisionmaking under conditions of uncertainty is always a challenge for businesses; decisionmaking in a thick fog of uncertainty is well-nigh impossible. It negates the power of hyper-accommodative monetary policy to propel our economic vessel forward. The restraining influence of rudderless fiscal policy is readily seen in the piling up of excess reserves on the balance sheets of banks and in the coffers of operating businesses.

I argue that the Fed has no hope of moving the economy to full employment unless our fiscal authorities get their act together. Those economic agents with the wherewithal to expand payrolls and put the American people back to work must have confidence that our fiscal authorities and regulation makers—the legislative and the executive—will reorganize the tax code, spending habits and the regulatory regime so that the cheap and abundant money we at the Fed have made available to invest in job-creating capital expansion in the United States is put to use. Until then, I argue that the Fed is, at best, pushing on a string and, at worst, building up kindling for a massive shipboard fire of eventual inflation.

All the World’s a Stage (and All the Policymakers Merely Players)

It is thus as-yet unclear whether the benefits of the strategy the Fed has taken outweigh its costs. Only time will tell. The Federal Open Market Committee will have to wait for the verdict of history. Scholars know that Shakespearian plays all have five acts. I would suggest that we are but in the third act of a play—we had the tempest in Act 1; the jury-rigging of monetary policy and radical maneuvers by the Fed to save the ship in Act 2; and in the present act, we are back on course but somewhat becalmed, sailing at less-than-desired cruising speed even as we have cranked up an auxiliary motor of large-scale asset purchases. Act 4 will involve the travails and challenges of adjusting our policy course, fine-tuning the motor and rearranging the rigging. And not until the final act will we know whether we have achieved the felicitous outcome that is the hallmark of most romantic plays, or whether the melancholy that defines a tragedy awaits us.

The romantic outcome ends, as most all Shakespearian comedies do, in a marriage—in this case, a marriage of sensible fiscal and monetary policy that lifts employment and carries the American economy to new heights.

The tragic outcome is one in which the fiscal authorities—the Congress and the president—are unable to provide incentives for risk takers to make use of the cheap and abundant capital the Fed has made available, and the play ends in a debasement of the central bank and the ruination of our economy and lifestyle.

The former outcome is that envisioned by the theoreticians that lead the Fed: According to this plot, by driving rates to historical lows along the entire length of the yield curve, investors will rebalance their portfolios and reach out to riskier assets, providing the financial wherewithal for businesses to increase capital expenditures and reengage workers, expand payrolls and regenerate consumption. Rising prices of bonds, stocks and other financial instruments will bolster consumer confidence. The CliffsNotes account of this play has the widely heralded “wealth effect” paving the way for economic expansion, thus saving the day.

The latter outcome posits that the wealth effect is limited, for two possible reasons. One is that our continued purchases of Treasuries are having decreasing effects on private borrowing costs, given how low long-term Treasury rates already are. Another is that the uncertainty resulting from fiscal tomfoolery is a serious obstacle to restoring full employment. Until job creators are properly incentivized by fiscal and regulatory policy to harness the cheap and abundant money we at the Fed have engineered, these funds will predominantly benefit those with the means to speculate, tilling the fields of finance for returns that are enabled by historically low rates but do not readily result in job expansion. Cheap capital inures to the benefit of the Warren Buffetts, who can discount lower hurdle rates to achieve their investors’ expectations, accumulating holdings without necessarily expanding employment or the wealth of the overall economy.

I hold no vendetta against the Buffetts of the world, having once been a junior member of that class—I made a nice living during the 1980s and ’90s buying operating assets for nickels and dimes and turning them into dollars by rationalizing and downsizing them. And like legions of others, I have for countless years read the Oracle of Omaha’s annual statement with admiration for his prowess as an investor and profit-seeker. But my role as a policymaker is different from my previous role as an investor: I have sworn fealty to a dual mandate of conducting monetary policy so as to maintain price stability AND create the monetary conditions for full employment and prosperity for all, not just for the rich and the quick. This, I fear, we will fail to do unless Congress and the president develop and deliver on a strategy that complements ours at the Fed.

This may be a sour ending to a somber song, but, after all, economics is not called “the dismal science” for nothing. Have a nice day!

Now, in the best tradition of central bankers, I would be happy to avoid answering your questions.

Is The Decline In Gold Predicting Deflation?

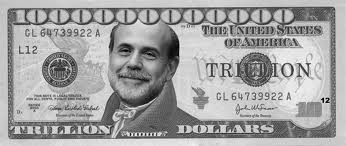
bernanke's paperBy GE Christenson

We all know that our cost of living in increasing, but how much?

The official government statistics assure us that inflation is running around 2% per year. It reminds me of the line attributed to Groucho Marx, “Who are you going to believe, me or your own eyes?”

But, your cost of living increase – your personal inflation rate – may be much larger or smaller than that of the person next door. Your spending choices matter a great deal in determining your personal inflation rate.

  • I think we can all agree that some items are increasing much faster than others. A few that come to mind are college tuition, medical care, hospital costs, and health insurance. Several that increase more slowly are postage and milk. If you spend more on medical care and health insurance than on postage, your cost of living increase will be much larger than the person who buys more stamps than health care.
  • If the official CPI goes up, then social security payments increase and total government expenses increase. Hence, government has an incentive to want low CPI inflation statistics. The US government has changed the process and the formula several times since the 1980s. The result, of course, is that the official CPI is low. Maybe it is fair, maybe not, but it is the official story, and it helps keep social security payments low.
  • The various statistical measures used to calculate the CPI have been discussed and criticized in detail in many other publications. In the opinion of many people, they don’t reflect economic reality for most people.
  • Other writers disagree and assure us the inflation rate is low.
  • John Williams, a competent economist and statistician, computes the annual inflation rate at about 9%. He uses the statistical calculation process that was used by the government in 1980.
  • Dennis Miller did an inflation rate survey. It was not intended to be statistically robust – just practical. His readers responded with an average inflation rate of 8%, but 23% of the respondents thought their personal rate of inflation was over 11% per year.
  • The Deviant Investor did a similar survey and received a large number of responses. Our readers thought their average inflation rate was nearly 8% per year, while 39% thought it was higher than 9% per year.
  • Rex Nutting thinks it is close to 3% per year and that most of us are “CPI Deniers.” Mainstream media mostly agrees – but I can’t find anyone (in casual conversation) in a grocery store who thinks food prices are only increasing 2 – 3% per year.

I estimate my personal inflation rate at about the average found in the surveys – around 8% per year. I am one of those “CPI Deniers.” Most people I know are “CPI Deniers.”

So How Important is a Few Percent Per Year?

A few percent seems unimportant, but over a decade it becomes very important. Let’s assume in this very simple example that your expenses increase 8% per year, and your income increases 3% per year. In year one your income was much larger than your expenses, and you saved the difference.

Sample Inflation Calculation

Year Income Expenses Net to
Savings
1 80,000 60,000 20,000
2 82,400 64,800 17,600
3 84,872 69,984 14,888
4 87,418 75,583 11,835
5 90,041 81,629 8,411
6 92,742 88,160 4,582
7 95,524 95,212 312
8 98,390 102,829 (4,440)
9 101,342 111,056 (9,714)
10 104,382 119,940 (15,558)

By year 8, in this simple example, the cost increases overwhelmed your income, and you were forced to withdraw from savings. Of course, in the real world, there are more variables and adjustments. We cut back on expenses, increase credit card debt, take a second job, win the lotto, file for bankruptcy – whatever. But the critical point is that your personal inflation rate is important, and a few percent over a decade can make a huge difference.

What to Do?

      • Cut back on expenses.
      • Get out of debt, and stop paying interest.
      • Increase your income.
      • Start a business, or take a second job.
      • Make investments that pay more than the minimal interest provided by savings accounts and certificates of deposit.
      • Invest in real things – gold, silver, diamonds, land, rental property.
      • Invest in “ABCD,” which for David Stockman is “Anything Bernanke Can’t Destroy.” We Have Been Warned!

According to the surveys, real people think their personal inflation rate is around 8% per year with a significant percent of the responders claiming 9 – 11% or more per year. Are you going to believe what the government is telling you or your own experience?

GE Christenson, aka Deviant Investor

The Gold Crash – Why It Doesn’t Matter

Physical-GoldBy:  GE Christenson

The NASDAQ 100 index peaked at 1,485 in July 1998. It subsequently crashed to below 1,070 in October 1998, a loss of about 28%. But, it climbed back to nearly 5,000 in March 2000, a rally off the low of over 350% in 17 months.

The S&P 500 index peaked in October 2007 around 1,575. It subsequently crashed below 670 in March 2009, a loss of about 57%. But, it climbed back to nearly 1,600 in April 2013, a rally off the low of over 135% in 49 months.

Gold was priced at nearly $200 in January 1975. It subsequently crashed to about $100 in August 1976, a loss of about 50%. But, it climbed back to over $850 in January 1980, a rally off the low of over 750% in 41 months.

Crude oil peaked at over $147 in July 2008. It subsequently crashed to under $36 in December 2008, a loss of about 75%. But, crude climbed back to over $114 in May 2011, a rally off the low of over 210% in 29 months.

Natural gas exceeded $15 in December 2005. It subsequently crashed to under $5.50 in September 2006, a loss of over 64%. But, natural gas climbed back to over $13 in July 2008, a rally off the low of over 130% in 22 months.

Gold was priced at about $1,920 in August 2011. It subsequently crashed to about $1,350 in April 2013, a loss of about 30%. Gold will probably climb back to a large number in the relatively near future, a rally off the low that will be really impressive.

Silver climbed to over $48 in April 2011. It subsequently crashed to under $23 in April 2013, a loss of over 52%. Silver will probably climb back to a very large number in the relatively near future, a rally off the low that will be quite impressive.

Markets rally, correct, rally, and correct again. Some of the corrections are so severe we call them crashes. In the big picture, it hardly matters whether the crashes were accidental, encouraged, manufactured, or all three. In the big picture, what matters are the market fundamentals. After the correction, have the fundamental drivers of the market changed?

Important Questions for Gold & Silver Investors

    • Are the central banks of the world still rapidly expanding the money supply?
    • Are the derivatives and currencies bubbles in danger of crashing?
    • Are governments still spending much more than their revenues?
    • Are central banks, governments, and wealthy individuals continuing to buy gold?
    • Is total debt rapidly increasing?
    • Is consumer demand for gold and silver increasing?
    • Is faith in unbacked paper money decreasing?
    • Are faith and trust in banks and politicians decreasing?
    • Does the financial world appear to be more dangerous and unstable each year?
    • Are the above imbalances unlikely to improve in the next few years?

If YOUR answer to most of the above questions is “yes,” then regarding YOUR big picture perspective, gold and silver are probably very good investments, in addition to being valuable insurance in case some or all of the above imbalances do NOT resolve favorably and safely. Yes, this is likely to end badly.

The recent crash in silver and gold was one of many for the record books. But, gold is not the same as Enron stock. Tangible physical metals that have been a store of value for over 3,000 years are not the same as a paper promise made by less than reputable individuals and organizations. In the world today, it seems there are many disreputable individuals, corporations, and governments, all pushing paper. We have been warned!

History suggests we should side with 3,000 years of history during which gold and silver have been a store of value and the ultimate real money. History suggests that we should not trust our savings with either the paper pushers or their unbacked paper money.

For silver and gold investors, there are 3,000 years of history supporting your viewpoint and your commitment. There have been many rallies and crashes in both markets; but, even at their recent crash lows, the price of both is over five times higher than their lows in 2001. New highs will occur. Don’t let the paper pushers frighten you out of your investments.

GE Christenson
aka Deviant Investor

The Financial System Has Reached The Implosion Point

coinA profound thanks to all the short term fickle speculators in gold and silver who have shifted their portfolio allocations to stocks, bank accounts and certificates of confiscation government bonds .  The shift to paper assets has provided what will in hindsight be the best buying opportunity for gold and silver since the crash of 2008.

BY:  GE Christenson

March and April 2013 may go down in history as the tipping point for the western financial system.

We have already seen:

  • Lehman Brothers and many other financial firms collapse.
  • $700 Billion in TARP funds arranged by banking insiders for banking insiders at the expense of US taxpayers.
  • Over $16 Trillion in bailouts, guarantees, swaps, and loans created by the Fed and given to various banks, nations, and other insiders.
  • MFGlobal took “segregated” customer funds, the exchange provided no compensation to customers, and yet no criminal indictments have been issued.
  • Global derivatives total $700 Trillion to well over $1,000 Trillion, depending on who is counting. Some are “toxic waste.”
  • Many European bailouts and “fixes.”
  • Spain, Italy, Slovenia, and perhaps France in trouble.
  • US official debt approaching $17 Trillion with unfunded liabilities many times larger.
  • The Federal Reserve creating $85 Billion per month (over $115,000,000 per hour) to support banks and the US government.

So what other disasters could occur? In a word, Cyprus!

  • Not because the EU and Cyprus took Russian money.
  • Not because several banks will close.
  • Not because some deposits will be confiscated and/or frozen.

In my opinion, the sign that a tipping point has occurred in the financial system is the real story:

  • The veil of banker honesty has been lifted. The EU/IMF/ECB will do whatever is necessary to support the banks, even if it means they will confiscate (tax, steal, bail-in) customer deposits.
  • Customer deposits are NOT assets held in the bank for safe-keeping, but are liabilities of the bank and are not guaranteed to be made whole.
  • Billions of dollars were removed prior to the Cyprus freeze, so insiders clearly knew in advance of the ordinary depositors (see below). There is no “level playing field” when billions of dollars/euros are in play.
  • According to Jeroen Dijsselbloem, Dutch finance minister and Euro Group President, this is “the template for any future bank bailouts.” In other words, your deposits are considerably less safe than you thought. Your bank could fail, and your deposits might be used to compensate for derivative losses or other losses that the bank incurred.
  • The FDIC in the US, as well as England, Canada, and New Zealand, has announced similar policies, agreements, and plans to confiscate deposits in the case of an emergency. Is this a sign that an emergency is not only possible but probable and imminent?
  • Confidence in the banking and financial system has been seriously damaged, perhaps irreversibly.

Following are a few quotes from respected commentators:

Jim Sinclair: If the fools that have attacked Cyprus persist then it is the start of an avalanche that will destroy confidence in fiat currency, the fractional reserve system and central banks. What are the central bankers terrified of? My answer is the mountain of old OTC derivative coming home to roost.” Link.

Tyler Durden: “With every passing day, it becomes clearer and clearer the Cyprus deposit confiscation “news” was the most unsurprising outcome for the nation’s financial system and was known by virtually everyone on the ground days and weeks in advance: first it was disclosed that Russians had been pulling their money, then it was suggested the president himself had made sure some €21 million of his family’s money was parked safely in London, then we showed a massive surge in Cyprus deposit outflows in February, and now the latest news is that a list of 132 companies and individuals has emerged who withdrew their €-denominated deposits in the two weeks from March 1 to March 15, among which the previously noted company Loutsios & Sons which is alleged to have ties with the current Cypriot president Anastasiadis.” Link.

Peter Cooper: “Depositors in the beleaguered Bank of Cyprus are now facing losses of 60 per cent on deposits over 100,000 euros as the Cyprus Government seems to have woken up to the fact that this is its last chance to steal money off these mainly foreign depositors. It’s an absolute travesty and a red letter day for European Union banks…

“Money in EU bank accounts is clearly now up for grabs by any government that recapitalizes its banking sector. Moreover, the Cyprus precedent is going to cause a run on the weaker banks that will make this sort of recapitalization inevitable. Standby for a systemic banking crisis in the EU…

“What the EU has done in Cyprus is the modern equivalent of the failure of the Credit Anstaldt in 1931 that brought on the Great Depression with thousands of banking failures around the world.” Link.

Jim Sinclair: “I believe Cyprus is the defining moment whereby the physical market for gold overtakes the paper market for gold as the arbiter of price. When that occurred in 1979 the price of gold began its move to seek its maximum valuation.” Link.

Julian DW Phillips: “When it was announced [in Cyprus] that both large and small depositors were to have a percentage of their deposits seized, it was not the amount that horrified the world but the discovery that you do not own your own bank deposits… Most investors worldwide are of the belief that when you deposit your money in a bank, it simply has safe-keeping of that money. The realization that you have lent the bank your money and are an “Unsecured Creditor” of the bank is an unpleasant revelation.” Link.

Michael Snyder: “What you are about to see absolutely amazed me when I first saw it. The Canadian government is actually proposing that what just happened in Cyprus should be used as a blueprint for future bank failures up in Canada.

The following comes from pages 144 and 145 of “Economic Action Plan 2013″ which you can find right here. Apparently the goal is to find a way to rescue “systemically important banks” without the use of taxpayer funds…”

“In addition, branches of the two largest banks in Cyprus were kept open in Moscow and London even after all of the banks in Cyprus itself were shut down. So wealthy Russians and wealthy Brits have been able to take all of their money out of those banks while the people of Cyprus have been unable to…”

“The global elite are fundamentally changing the game. From now on, no bank account on earth will ever be able to be considered “100% safe” again. This is going to create an atmosphere of fear and panic, and no financial system can operate normally when you destroy the confidence that people have in it.

Confidence is a funny thing – it can take decades to build, but it can be destroyed in a single moment.” Link.

Ellen Brown: “Confiscating the customer deposits in Cyprus banks, it seems, was not a one-off, desperate idea of a few Eurozone “troika” officials scrambling to salvage their balance sheets. A joint paper by the US Federal Deposit Insurance Corporation and the Bank of England dated December 10, 2012, shows that these plans have been long in the making; that they originated with the G20 Financial Stability Board in Basel, Switzerland (discussed earlier here); and that the result will be to deliver clear title to the banks of depositor funds.” Link.

Richard Russell: “I’ve been asked to name one future situation of which I’m most certain. My answer is this – I believe the surest situation (change) in America’s future is a decline, even a drastic decline, in our standard of living. We’ve spent it; we’ve spent what we didn’t have. And somewhere ahead, probably much sooner than we think, will come payback time. And it won’t be pretty.” Link.

Summary

GE Christenson
aka Deviant Investor

Why The Long Term Price of Silver Is Guaranteed To Rise

By: GE Christenson

Walking-Liberty-HalfBegin the analysis in 1971 when Nixon dropped the link between the dollar and gold. A pack of Marlboros cost (depending on local taxes) about $0.39. We paid about $0.36 for a gallon of gasoline. The DOW Index was about 850. Silver was priced at about $1.39.

Times have changed! Read Part 1 of Silver – Keep It Simple!

Today we have more currency in circulation, far more debt, and much higher prices – what does it mean?

Examine Graph 1. The prices for retail cigarettes, crude oil, national debt, silver, and the true money supply (TMS) (see notes at end) are shown on a log scale graph with all prices normalized to start at 1.0 in 1971.

Click on image to enlarge.
  • National debt (green line) has increased rapidly since 1971 and even more rapidly, on average, than the other items. (National debt has increased over 12% per year for the last five years.)
  • Silver (black line) and crude oil (red line) prices have been erratic with peaks in the early 1980s, troughs in the late 1990s, and substantial rises since 2001.
  • Cigarettes and TMS have increased steadily since 1971.
  • TMS (also M2, M3, etc.), debt, and most commodity prices have increased exponentially since 1971. Because the dollar was not backed by gold, dollar creation, total debt, and prices increased rapidly.
  • Not shown are some prices that increased more rapidly (medical costs and college tuition) and some that increased more slowly (postage and bread).

Graph 2 shows annual silver and crude prices smoothed with a centered five period moving average. This removes much of the “noise” in the price data and shows longer term trends better. Note that the price of silver actually reached about $50 per ounce in early 1980, but the average daily price in 1980 was only $16.39; the smoothed daily average was about $11.

Click on image to enlarge.

Statistical Correlations

  • Silver prices in dollars (annual average of daily price) correlated with crude prices in dollars (annual average of daily price) at 0.83 – a good correlation. Both are commodities, both are affected by politics, and both are sensitive to money supply, actual inflation, and inflationary expectations.
  • TMS correlated with national debt at 0.99 – a tight correlation. When budget deficits increase the national debt, the money supply expands accordingly.
  • Silver prices (annual average shown) correlated with national debt at 0.67 and with TMS at 0.58. The smoothed silver price correlation to national debt was 0.76 over 40 years and much higher over the past 13 years.
  • Silver prices (smoothed) correlated with crude prices (smoothed) at 0.93 – an excellent correlation.

So What?

  • National debt correlates tightly with TMS. Smoothed silver prices correlate well with both national debt and TMS. We may be apprehensive about future silver prices, but we can be 99.99% certain about the inevitable increase in national debt. Based on the 40 year correlation between silver and national debt, silver prices will continue to rise.
  • Both crude oil and silver are commodities that experience large price volatility. On average, they go up and down together; and, over a 40 year history, their prices have clearly moved substantially higher. I see many reasons to expect both to move higher in the long term.
  • Crude oil is the most important commodity in the world. Its per capita use, on average, is rising and the world’s population is increasing, so demand will remain strong, unless the world suffers a massive financial and economic collapse. Further, the easily available oil has been taken so there is little chance that inexpensive supply will increase. More demand coupled with flat or declining supply requires higher future prices. Higher crude oil prices strongly suggest higher silver prices.
  • Central banks are “printing money” in their desperate attempt to fight deflation, levitate asset prices, bailout banks and countries, and encourage inflation. This guarantees further increases in national debt and TMS and price increases for most commodities including crude oil, cigarettes, and silver.

Price of Silver as a Projection Based on Other Variables

We can construct a calculated price for silver based on three variables – national debt, TMS, and the price of crude oil. Examine Graph 3 of smoothed silver prices and the calculated price of silver based on those three variables. Note that the correlation is 0.86 – quite good. The silver price has both a monetary component (national debt and TMS) and a commodity component (crude oil). Together they produce a simple but effective projection for the smoothed average price of silver over the past 42 years.

Click on image to enlarge.

For the Future

Assume national debt increases 12% per year for the next five years like it has for the past five years. Assume TMS and crude continue their past five year growth rates (11% and 8%). The estimated price for the smoothed average price of silver is about $55 in 2016. The peak price on a spike higher could easily be triple the smoothed price. Look for $100 silver in 2015 – 2017 unless a deflationary collapse occurs – to the detriment of everyone including banks, politicians, and national governments.

Conclusion

Debt, money supply, and the prices for most commodities have exponentially increased over the past 42 years. Prices for crude oil and silver have substantially increased but inconsistently. I can be certain of death and taxes, and I feel confident that the national debt and prices for crude oil, cigarettes, silver, and most other consumer items will drastically increase in the next few years – under circumstances similar to the past 40 years. A hyperinflationary increase is also possible, in which case, all commodity prices will be unbelievably higher. Assuming no deflationary collapse, expect $100 silver relatively soon – perhaps in 2016. Read Past & Future Speculative Bubbles – What They Indicate for Gold and Silver!

GE Christenson
aka Deviant Investor

The Fundamental Reasons For Owning Gold and Silver Are Stronger Than Ever

One of the best methods for protecting wealth against a constantly depreciating paper currency is to own precious metals.

The bull case for precious metals remains intact as central bankers worldwide have become the lenders of last resort for nations that have exhausted their borrowing capacities.  Very little has changed since 2008 when the world financial system stood at the abyss of collapse.  Unsustainable debt levels continue to increase even as the capacity to service the debt diminishes.

As discussed in Why There is No Upside Limit For Gold and Silver Prices, the U.S. has reached a tipping point on the road to insolvency. Despite trillions in stimulus spending, both job creation and economic growth have been extremely weak and are likely to remain so.

Economists Kenneth Rogoff and Carmen Reinhart, authors of This Time Is Different: Eight Centuries of Financial Folly, offer comprehensive statistical evidence of the dangers of excessive public debt.  As documented in their book, once public sector debt reaches 90% (which the U.S. is very close to) a country has only three options, all of them bad.

According to Rogoff and Reinhart, the only way out for overleveraged nations is a restructuring through default, austerity or allowing inflation to increase while repressing interest rates at a very low level.

Default is the most drastic and least likely remedy to be used by a country such as the United States which issues its own currency and can create an unlimited number of dollars to service debt payments.

Austerity, the second option, is a highly unlikely scenario under our current democratic system.  Any politician voting for austerity measures would quickly be voted out of office and replaced by another politician promising continued funding of the social welfare state.  Since over half the country’s population currently depends on entitlement programs to survive, the power of the majority vote guarantees that austerity will not  become a policy for putting the country back on a fiscally sound economic path.  The inability to reduce unsustainable spending  or impose confiscatory rates of taxation leaves the government with one bad option – print more money.

The United States is currently locked into policy options that guarantee a long term rise in gold and silver prices.  The current weakness in precious metals represents a buying opportunity for those seeking to accumulate and protect their wealth over the long term.

APMEX Reports Sales Spike on eBay Bullion Center

Last  Wednesday, with New York gold down over $40 per ounce, even long time gold bulls were advising caution before committing to further investment.  Some precious metals dealers reported a flood of panic selling by anxious investors who were unloading physical coin and bar.

With everyone fearful of lower prices, exactly who was buying all that gold and silver from panicked investors?

Michael Haynes, CEO of APMEX, one of the countries largest precious metals dealers, said “As gold and silver prices continue to drop, long-term investors immediately reacted to the market movement. Recognizing that the precious metals were on sale and at a discount relative to the expected future values, buyers of physical bullion increased purchasing at the APMEX Bullion Center on eBay.”

Michael Haynes explained further.

“This was the second largest selling day for the APMEX Bullion Center on eBay since inception about five months ago, beating the next highest selling day by more than 30%. As Gold and Silver prices fell, heavily influenced by the reaction of day traders to the minutes from the recent Federal Reserve Open Market Committee meeting, physical sales of both metals skyrocketed. Buyers of physical Gold and Silver have a moderate to long term view and concluded that with the price movements, the precious metals were on sale and at a discount relative to the expected future values. These investors in physical Gold and Silver apparently see the long term issues faced by the U.S. economy and seek some asset allocation into the non-correlated asset class of precious metals to protect and hedge their investments in paper assets like Stocks and Bonds.”

According to APMEX, the top sellers on the Bullion Center are the 1 oz Silver American Eagle, the 1 oz Gold American Eagle, the 5 gram Statue of Liberty Credit Suisse Gold Bar and the 100 oz Royal Canadian Mint Silver Bar.

Every bull market has corrections which offer long term investors the opportunity to add to positions at bargain prices.  The high volume of gold and silver purchases on the eBay Bullion Center indicates that mainstream buyers remain committed to precious metals as a method of wealth preservation.

Expect $200 Silver As The Shift To Real Assets Accelerates

By: Deviant Investor

silver-coin-sm

    • Silver has no counter-party risk. It is not someone else’s liability. Silver Eagles or Canadian Silver Maple Leaf coins are recognized around the world and have intrinsic value everywhere. The same is NOT true for hundreds of paper currencies that have become worthless, usually because the government or central bank printed them to excess to pay the debts of governments that did not control spending.
    • The price of silver in US dollars since the year 2001 has been strongly correlated with the ever-increasing official national debt of the United States. Read $100 Silver! Yes, But When? I doubt that anyone believes the national debt will decrease or even remain constant over the next four years. We have every reason to believe that it will increase by well over $1,000,000,000,000 per year for many years. If the national debt is rapidly increasing and it correlates, on average, with the price of silver, then we can be reasonably certain that the HIGHLY VOLATILE price of silver will increase substantially over the next few years.

Click on image to enlarge.
    • Silver has been used as money (medium of exchange and a store of value) for over 3,000 years. In most cultures, silver has been used for daily transactions far more often than gold. I have read that the word for “money” is the same as the word for “silver” in many languages.
    • In the United States silver was used as money – coins – until the 1960s when inflation in the paper money supply caused the price of silver to rise sufficiently that silver coins were removed from circulation. Do you remember silver dollars? They contained approximately 0.77 ounces of silver. Currently the US Mint produces silver eagles which contain 1.0 ounce of silver – and cost approximately $35.

silver-coin

  • Argentina has devalued their currency several times and has dropped eight zeros off their unbacked paper money in the past 30 years. The United States has not dropped any zeros from dollars, but it took approximately one-half of one dollar to buy an ounce of silver 100 years ago, while it takes over 30 in today’s reduced value dollars. It took about 20 dollars to buy an ounce of gold 100 years ago and it takes over 1,600 dollars to buy that same ounce of gold today. There are many more dollars (paper and electronic) in circulation today compared to 100 years ago. Hence the prices, measured in declining value dollars, for silver, gold, wheat, crude oil, bread, coffee, and ammunition is MUCH larger.


  • Throughout history the prices of gold and silver have increased and decreased together, usually with gold costing 10 to 20 times as much as silver. A historical ratio of 15 or 16 is often quoted and that places the current ratio, which is in excess of 50, as relatively high. Since Nixon “closed the gold window” on August 15, 1971 and allowed the dollar to become an unbacked paper currency that could be created in nearly unlimited quantities, the gold to silver ratio has ranged from a high of approximately 100 to a low of approximately 17. There is room for silver prices to explode higher, narrowing the ratio to perhaps 20 to 1. When gold reaches $3,500 (Jim Sinclair) and subsequently much higher in the next few years, and assuming the ratio drops to approximately 20 to 1, the price of silver could approach $200 per ounce, on its way to a much higher number, depending on the extent of the QE-Infinity “money printing,” panic, hyperinflation, and investor demand.


  • If you think a silver price of $200 per ounce is outrageous, I suspect you would find near universal agreement among most Americans. But is a national debt in excess of $16,000,000,000,000 less outrageous? If unfunded liabilities are included the “fiscal gap” is, depending on who is calculating it, approximately $100,000,000,000,000 to $220,000,000,000,000. For perspective, that places the unfunded liabilities of the US government at approximately $700,000 per person in the United States. Is $700,000 unfunded liability (debt) per man, woman, and child more believable than a price for silver of $200?

It seems likely that the populace will eventually realize that:

  • Government spending is out of control and will not be voluntarily reduced.
  • “Printing money” or debt monetization (QE) is necessary and inevitable in order to continue funding the excess spending of the US government. More money in circulation means a declining purchasing power for the dollar. The decline is likely to accelerate at some time in the future.
  • The real value of our savings and retirement diminishes as the dollar declines in value.
  • People will panic and shift into real assets to preserve their purchasing power. (There is no fever like gold fever!)
  • That panic will cause gold, silver, and many other real assets to drastically increase in price, as measured in devalued dollars.
  • It is better to be early than late if a panic-moment is about to arrive.
  • Silver is less expensive per ounce than gold and more available for purchase than gold, particularly for middle-class westerners. An investment into silver is likely to appreciate more than a similar investment in gold.

What Do You Believe?

  • Do you believe that excessive spending and debt will be reduced?
  • Do you believe that the decline in purchasing power of the dollar over the last 100 years will suddenly
  • Do you believe that congressional promises for Social Security, Medicare, Medicaid, and government pensions will be broken?
  • Do you believe the Federal Reserve will continue to print the money to pay for those promises?
  • Do you believe your savings and retirement are totally safe in paper investments denominated in dollars?
  • Do you believe, as history indicates, that paper money eventually devalues to zero while gold and silver retain their value?
  • Do you believe that the world will suddenly stop using silver, instead of finding new uses for it every year?
  • Would you rather trust silver coins in a safe place or paper money and political promises?
    Most people will do nothing to protect their financial future. Will you?
    GE Christenson
    aka Deviant Investor