 By: GE Christenson
Silver prices peaked in April 2011 and dropped about 60% over the next 25 months. Sentiment by almost any measure is currently terrible. Few are interested in silver; most have lost money (on paper) if they bought in the last two and one half years, and the emotional pain seems considerable. It reminds me of the years after the NASDAQ crash in 2000.
So will silver drop under $15 or rally back above $50?
To help answer that question, I examined the chart of silver for the last 25 years and identified several long-term cycles. Then I constructed a spreadsheet that attempted to model the price of weekly silver based on those cycles and a few assumptions.
Assumptions
- Use only long-term cycles – a year or longer.
- The weight assigned to each cycle is approximately proportional to its length. A 200-week cycle should be approximately twice as heavily weighted as a 100-week cycle.
- This is NOT a trading vehicle but a long-term indication of reasonable price projections based on past relationships. Those past relationships may or may not continue, even if they have been valid for over 20 years.
- Keep it simple. Do not over-complicate the model or aggressively “curve-fit” it.
- Prices are assumed to rise more slowly than they fall, so 62% of the cycle is related to the rising portion of the cycle, and 38% of the cycle is related to the falling portion of the cycle.
Data
| Low-to-Low cycles: | 65 weeks, 72 weeks, and 234 weeks |
| High-to-High cycles: | 102 weeks |
| Exponential growth: | 1/1/1990 – 6/30/2002: no growth – 0.0%/year |
| 6/30/2002 – present: 21% per year, calculated weekly |
Process
Find the beginning dates (lows) for the 65, 72, and 234 week cycles, and assign those beginning dates an index value of -1.0. Proportionally increase those index values from -1.0 to +1.0, and then reduce those index values from +1.0 to – 1.0, and repeat for each low-to-low cycle. Use the beginning index value on the 102-week high to high cycle as + 1.0. Extend the proportional increases on all time cycles from -1.0 to + 1.0 so that period takes 62% of the cycle length.
Assign each cycle a weight approximately proportional to the cycle length. Use a beginning value and calculate the exponential increase (0% or 21% per year) for each week, and then add or subtract the percentage changes for each weekly time cycle. Adjust the cycle index weights to obtain the best visual fit on a graph of actual silver prices versus the calculated price of silver.
What Could Go Wrong?
- The exponential increase might not continue from 2013 forward. I doubt it, but it is possible.
- The cycles, although relevant for over 20 years, might be less relevant from 2013 forward.
- The calculated price was “curve-fit” to the actual prices, and that “curve-fit” result might be less accurate from 2013 forward.
Results
Statistical correlation over the last 20 years is about 0.95. The calculated silver price is generally consistent with the actual silver price, even though occasional large variations are clearly evident.

Highlights
Calculated low: 2/4/05 at $4.96
Actual low: 5/7/04 at $5.60
Calculated high: 3/17/06 at $13.33
Actual high: 5/12/06 at $14.24
Calculated high: 5/4/07 at $18.13
Actual high: 3/14/08 at $20.66
Calculated low: 12/12/08 at $8.15
Actual low: 10/24/08 at $9.30
Calculated high: 3/2/12 at $42.98
Actual high: 4/29/11 at $48.59
Calculated low: 5/10/13 at $23.32
Actual low: 5/17/13 at $22.25 (actual weekly low, so far)
The Future
This simple model, which uses only four cycles and an exponential increase, indicates that a low in the silver price was expected approximately February – July 2013 and that the next high is expected approximately Mar – October 2014 in the $50 – $60 range. Further, the model suggests that a silver price of $90 – $110 is possible in the September 2015 – March 2016 time period.
Caveats!
There are many. This is not a prediction, it is simply a projection based on the entirely reasonable, but possibly incorrect, assumption that silver prices will continue to rise about 20% per year, on average, and that these four cycles will push actual prices well above and below that exponential growth trend.
Why will silver prices continue to increase? Our current monetary system depends upon an exponentially increasing debt and money supply. It seems likely that the US government will continue to run massive budget deficits and thereby increase total debt. In addition, the central banks of Japan, the EU, and the US will continue to monetize debt and increase the money supply to promote asset inflation and to overwhelm the deflationary forces in their respective economies. Silver supply increases slowly, the demand increases much more rapidly, while each Dollar, Euro, & Yen purchase less, on average, each year. It seems quite reasonable to expect that silver (and gold) prices will increase substantially from their current low level. Read: Silver – A Bipolar Roller Coaster.
Timing
The model was basically correct (over the last decade) on timing and price with some large variations. Clearly there are more factors driving the price of silver than four simple cycles. Those political, emotional, and economic factors will push the price higher or lower, sooner or later, than the model indicates. Regardless, it has some value indicating the approximate price and timing for long-term highs and lows in the price of silver.
Use it while appreciating its limitations. Read: Back To Basics: Gold, Silver, and the Economy.
GE Christenson
aka Deviant Investor
 Rick Rule
 MOTIVE: The various governments of the world and their central banks produce and distribute a product – paper currencies. Those currencies are backed by confidence, faith, and credit, but not by gold, oil, or anything real. Those currencies are digitally printed to excess, since almost all governments spend more than their revenues. The UK, Japan, and the USA are prime examples.
 Richard W. Fisher, president and CEO of the Federal Reserve Bank of Dallas gave a very interesting speech today, acknowledging that the Federal Reserve policy’s are experimental. No one, including the Federal Reserve, knows how this unprecedented monetary accommodation will affect the economy and the value of the dollar.


 April was a brutal month for precious metal investors. Gold ended the month down almost 8% and silver prices tumbled almost 13%. The sell off continued in May with gold down another $60 per ounce to $1,412 and silver down $1.55 to $22.87 per ounce at mid month.
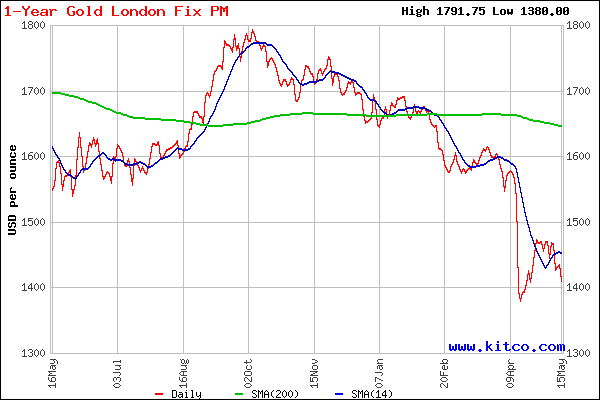

 By: GE Christenson
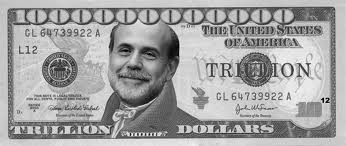 By GE Christenson
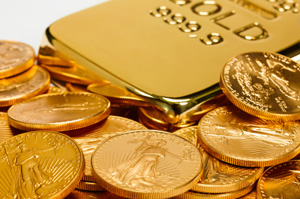 By: GE Christenson
 Don’t precious metal investors read newspapers? Despite proclamations from the mainstream press that the bull market in gold and silver is over, a buying frenzy in precious metals is occurring worldwide. The gold rush mentality to buy gold and silver at bargain prices has resulted in stock out conditions for many retail sellers of precious metals, including