April 25, 2024

Gold and Silver Prices Push To New Highs, Gold Silver Ratio Drops To 28 Year Low

Gold and silver prices, as measured by the London PM Fix Price, moved to new highs on the week.

Gold, as measured by the closing London PM Fix Price, gained $16 per ounce on the week and hit an all time high of $1,447 on Thursday.  After soaring 30% last year, investors still have plenty of reasons to allocate part of their portfolio to precious metals.

Precious Metals Prices
Fri PM Fix Since Last Recap
Gold $1,436.00 +16.00 (+1.13%)
Silver $37.68 +2.53 (+7.20%)
Platinum $1,752.00 +32.00 (+1.86%)
Palladium $754.00 +27.00 (+3.71%)

Silver was once again the standout performer among the precious metals, gaining $2.53 per ounce on the week.  The price of silver has now risen by over 10% in the past two weeks and is up from a yearly low of $27 in late January.  Silver has far outpaced the gains in gold, which has resulted in a decline in the gold/silver ratio to 38, which is the lowest since late 1983.  A return to the long term historical gold/silver ratio would result in silver prices approaching $100 per ounce.

SILVER - COURTESY STOCKCHARTS.COM

The surge in silver prices caused the CME to increase margin requirements on silver futures, which contributed to a pullback in prices on Thursday.  The move by the CME was seen by some as a manipulation tactic to bring down the price of silver, but increased margin requirements are common when prices are rapidly increasing.  Small and underfunded speculators may have to liquidate, but in the long term silver will merely move from weak hands to strong hands.  Increased margin requirements on highly leveraged positions can produce a short term sell off, but it does nothing to change long term fundamentals.

Platinum and palladium, which both lost over 3% last week, gained on the week as fears of reduced industrial demand were eased by estimates of the huge reconstruction cost in Japan.  The rebuilding of Japan is likely to result in higher prices for all types of commodities and an increased rate of global inflation.
Gold and Silver Prices Gain on Week

As measured by the London PM Fix price, gold and silver prices gained on the week after declining approximately 1% each in the previous week.  Gold gained $8.50 per ounce on the week to $1,420.00.  Silver was the stand out gainer on the week with a 3% or $1.05 per ounce gain.   As the situation in Japan and Libya stabilized somewhat, the recent panic selling in financial markets subsided as bargain hunters moved in, although in late trading, stocks gave up much of their gains.  Gold and silver also pulled back slightly in New York trading with gold at $1417.80 and silver at $35.10.
As market analysts worried about the potential for slower economic growth due to the disaster in Japan, classic industrial metals saw further price erosion after significant losses in the prior week.  Platinum fell by $57 on  the week and palladium dropped by $27.  Over the past two weeks, platinum has declined by $108 or over 6% while palladium was off $84 for over a 10% loss.

Precious Metals Prices
Fri PM Fix Since Last Recap
Gold $1,420.00 +8.50 (+0.60%)
Silver $35.15 +1.05 (+3.08%)
Platinum $1,720.00 -57.00 (-3.21%)
Palladium $727.00 -27.00 (-3.58%

As discussed last week , the fundamental forces propelling gold higher remain intact.  The devastation in Japan will require massive amounts of additional borrowing by a government already reaching the limits of its borrowing ability.  Expect Japan to follow the policy of the Federal Reserve with massive amounts of quantitative easing.   The currencies of Japan, Europe and the United States all face a loss of real purchasing value as governments engage in money printing to meet spending and borrowing needs that have spiraled out of control.

The toxic combination of  low economic growth, weak personal incomes and public resistance to additional tax increases have left governments with no other choice than to engage in massive expansion of the public debt.  As constraints on governments’ borrowing ability have grown, the last resort option of money printing will continue to result in the debasement  of currencies.  Increases in the price of precious metals have no upside limit under this scenario.

Silver remains the primary investment choice of many as the metal reasserts itself in relationship to the price of gold.  If the very long term historical gold silver ratio reasserts itself as many expect, the price of silver could easily close in on the $100 per ounce level.

SLV - Courtesy yahoo finance

Gold and Silver Prices Higher as Platinum and Palladium Sell Off

As turmoil reigned in the Middle East and worries mounted over the reduction of oil supplies, gold and silver proved their safe haven status as both moved higher in price.
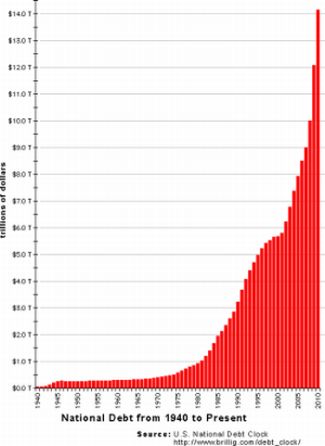
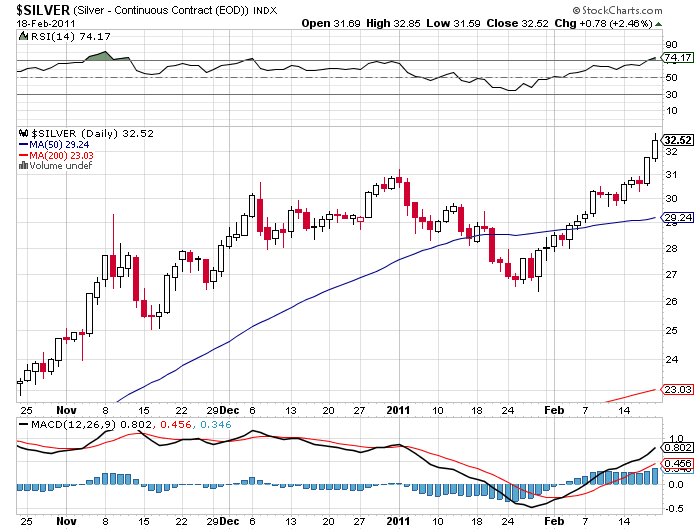
After a very solid gain of $1.94 per ounce last week, silver continued its upward move with another gain of $.60.  The closing London Fix Price for silver was $32.54 for a gain of 1.88% on the week.   The normal price consolidation and pullback in silver that extended from the beginning of the year into the end of January was the setup for a solid breakout into new highs.  Silver has now advanced over 20% from the lows of January.

SILVER - COURTESY STOCKCHARTS.COM

Besides the safe haven/currency alternative lure of silver, the fundamentals in silver are forecasting further dramatic price gains.   There have been numerous reports documenting physical shortages of silver as well as huge investment demand in the U.S., India and China.

One solid indication of the huge demand for physical silver is evidenced by the backwardation in prices.  Typically, the forward price of a commodity will exceed the cash price due to the expenses of insurance, warehousing and inventory financing.  When a commodity has a normal upward pricing curve to reflect a higher futures cost, the situation is termed contango.  Backwardation, the unusual case where the cost of the physical commodity is higher than future prices, is a classic indicator of surging demand.  Another indicator of the great demand for physical silver is the four year low of Comex warehouse silver.

Precious Metals Prices
Fri PM Fix Since Last Recap
Gold $1,402.50 +19.00 (+1.37%)
Silver $32.54 +0.60 (+1.88%)
Platinum $1,791.00 -45.00 (-2.45%)
Palladium $785.00 -62.00 (-7.32%

Gold also continued its upward move with a gain of $19 per ounce after an advance of $19.50 in the previous week.  To understand the wealth preservation appeal of gold, one needs only to look at the exponentially increasing level of  U.S. debt.  Ultimately, the staggering amount of sovereign debt can be serviced only through inflation and dollar debasement which is what the Federal Reserve is currently orchestrating through quantitative easing (money printing).

US NATIONAL DEBT - THE ROAD TO FINANCIAL OBLIVION

The U.S. dollar also appears to be losing its cache as the “safe haven” currency.  Despite the unprecedented turmoil in the Middle East and the rise in oil prices, the U.S. dollar has weakened over the past two weeks.  By comparison, during the financial crisis of 2008, the U.S. dollar appreciated 24% against other major currencies.

The surge in oil prices has led to concerns that the U.S. and world economies will see much lower growth as higher oil prices devastate consumer disposable income.  A weakened world economy would probably lead to lower demand for industrial metals such as platinum and palladium which both declined this week.  Platinum sold off by $45 and palladium was rocked by a $62 loss from the prior week.

Silver Soars to 30 Year High as Precious Metals Resume Upwards Trends

After a brief consolidation below the 50 day moving average in late January, silver resumed its uptrend with a vengeance.  The London PM fix price for silver closed at $31.94 up from $30.00 the previous week.  Since late January, silver has rocketed $5.50  for over a 20% gain.

Silver - courtesy stockcharts.com

The fruitless budget reduction talks in Washington, a slide in the US Dollar Index and a new high on silver are certain to ignite the precious metal markets into another major move upwards.  Most investors under the age of 50 probably don’t remember the last time silver prices have soared past $30 in the early 1980’s.

Technically and fundamentally, silver is poised to make a major move.  Price movements coming out of long bases usually have a long duration.   Silver has broken out from an ultra long base of over 25 years.  The initial move from the $5 area to $30 is simply the first phase of what should turn out to be a major upward move.

Long term silver

Silver hit an all time high of $48.70 in January 1980.  The inflation adjusted historical high for silver is $130 per ounce.  Considering the horrendous manner in which sovereign states are conducting their financial affairs and the potential for another financial crisis, the inflation adjusted high of $130 will look like a bargain price at some future date.

The closing London Fix Prices showed gains across the board from the previous week.  Silver was the standout performer with a gain of 6.5%.

Precious Metals Prices
Fri PM Fix Since Last Recap
Gold $1,383.50 +19.50 (+1.43%)
Silver $31.94 +1.94 (+6.46%)
Platinum $1,836.00 +7.00 (+0.38%)
Palladium $847.00 +25.00 (+3.04%

Gold and Silver Recap: Back to Work

Another Precious Week

So the holiday season, with decent job creation statistics, has seen some uncustomary cheer for the dollar, and on the face of it this seems to be the main driver for the weakness of gold and silver prices.  After all if you’re priced in dollars, and the dollar goes up then your price goes down.  The last week has been particularly bad for gold, with a 3.5% fall (the figures below cover the whole of the holiday period) which is the largest week on week fall for six months.

The long term trend still looks like it’s going to be up, as the Central Banks are starting to buy gold, apart from the Fed – although if Ron Paul gets his way then Uncle Sam may stop being a hold out as well.

Precious Metals Prices
Fri PM Fix Since Last Recap
Gold $1,367.00 -1.50 (-0.11%)
Silver $28.39 -0.39 (-1.36%)
Platinum $1,735.00 +39.00 (+2.30%)
Palladium $754.00 +16.00 (+2.17%)

Gold-Silver Ratio: 48.15 (was 47.55)

So far the Central Banks that are buying gold are the scary ones; Russia, China and Venezuela.  But one of the more interesting things is that they are doing this in secret.  If it was an attempt to finish off the dollar then this would be in the open.  No, they are seeing gold as an integral, and underweight part of the reserves that are going to underpin their currencies in the future.  In other words an unofficial, secretive return to the gold standard.  This sort of thing is not a long run dampener on the gold price.

Silver also did badly, which was shown in a rather big slip in the gold silver ratio.  If the idea is that silver is priced around a third of its long term price when compared to gold, well it shouldn’t be going in this direction.  Now I don’t fully buy the idea that silver has got to come to around fifteen ounces to an ounce of gold, or at least any time soon.  But it hard to deny that it is out of balance.

What is even odder is that platinum and palladium have seen a large rise over the holiday period.  While gold can have a life of its own, and it’s true that palladium can have more to do with what the Russian ministry of mines is up to, silver and platinum are quite similar.  While platinum and palladium have seemed to be riding the same industrial metal climb as copper, silver seems to have decoupled with the feeling that perhaps we’ve overestimated the inflationary potential for the dollar with the classic inflation hedge of silver taking the hit.

US Mint American Palladium Eagles

Palladium EaglesPrecious metals investors and coin collectors may soon be able to purchase American Palladium Eagle coins from the United States Mint. The bill H.R. 6166 was passed in both the House and Senate and signed into law by the President on December 14.

The .9995 fine, one ounce palladium coins will be produced provided that a required marketing study demonstrates sufficient demand  for palladium bullion coins produced by the United States Mint exists. The first coins are required to be minted and issued within one year of the submission of the study.

Specific guidance is provided regarding the sourcing of palladium for use in the new bullion series. It must be purchased from palladium mined from natural deposits in the United States within one year after the month in which the ore is mined. If no such palladium is available or it is not economically feasible, other available sources may be utilized.

Designs for the Palladium Eagle will be high relief likenesses of Adolph A. Weinman’s Mercury Dime obverse and 1907 AIA medal reverse. Both bullion and collector coins would feature these designs, although the collector coins could be issued in proof and uncirculated versions, with different surface treatments.

The bill authorizing the Palladium Eagles was introduced by Denny Rehberg of Montana, the only state in the U.S. where palladium is mined. The Congressman had presented the program as a way to fill a niche for investors and collectors, and to counterbalance the effects of General Motors decision to end its supply agreement with Montana’s Stillwater Mining Co.

Today, it was announced that General Motors decided to renew their supply agreement with Stillwater in a three year deal. Stillwater also supplies palladium to Ford Motor Co. until a contract due to expire at the end of the year.

Platinum Price Underperforms Gold, Silver, and Palladium

In what has been a strong year for precious metals, platinum is showing only a modest gain of 13.35% for the year to date. This is below the gains experienced for gold and silver, and far below the nearly 75% gain for palladium.

After peaking at $2,273 per ounce in March 2008, platinum dropped precipitously to a low of $763 per ounce by October of the same year. While other precious metals have reattained their 2008 high water marks and then some, platinum has lagged behind.

Gold, Silver, Platinum, and Palladium Performance (London Fix Prices)

Dec 31, 2009 Nov 18, 2010 Change Percent
Gold 1,087.50 1,350.25 262.75 24.16%
Silver 16.99 26.57 9.58 56.39%
Platinum 1,461.00 1,656.00 195.00 13.35%
Palladium 393.00 684.00 291.00 74.05%

The relative under performance of platinum compared to palladium can be explained by the supply and demand situation. While platinum is forecast to be in a surplus of 290,000 ounces for the year, palladium will be in a deficit of around 200,000 ounces. There has been more demand for palladium, which is used in catalytic converters for gas powered automobiles, than platinum, which is used in diesel devices. Palladium recently hit a nine year high above $700 per ounce.

The ratio between the price of platinum and palladium is 2.42, which is the lowest ratio is more than seven years.

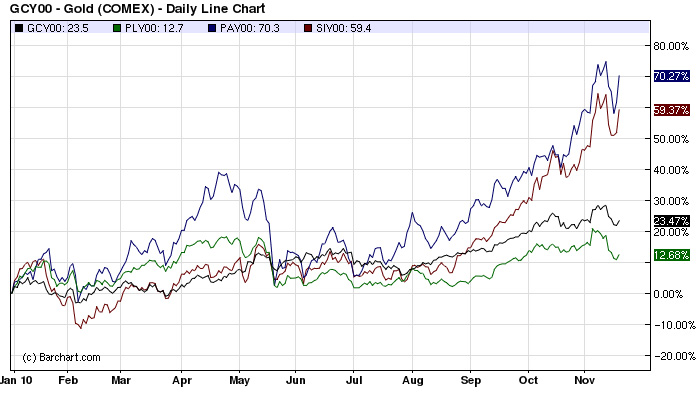
Gold, Silver, Platinum, Palladium Chart (COMEX Prices)

Gold and silver prices have benefited from strong demand from investors. Global fiscal imbalances and currency tensions have brought attention to these metals’ historic status as stores of value and inflation hedges. Due to platinum’s predominantly industrial uses and the supply surplus noted, it has not been as significant a beneficiary.

The price difference between platinum and gold is currently $305.75. When platinum reached its peak price in March 2008, the difference had expanded to $1,289. The metals traded close to parity in mid-December 2008.

Palladium Price at Nine Year High

While gold and silver have dominated the media spotlight this year, the price of palladium has outperformed both. For the year to date, palladium is up $337 per ounce or more than 85%.
By comparison, gold has risen $333.50 per ounce or 30.67% from the start of the year. Meanwhile, silver has risen by $11.56 per ounce for the year to date, or around 68%. Much of silver’s rise has come over the course of the past three months.

November 19, 2010 London PM Fix Prices
Gold $ 1,421.00
Silver $ 28.55
Platinum $ 1,786.00
Palladium $ 730.00

Palladium’s strong performance began following the sharp decline across all precious metals prices that took place at the end of 2008. Measured from palladium’s low of $164 reached in December 2008, the price is up an astonishing 345%.

From gold’s low price of $712.50 reached in October 2008, the price increase measures about 100%. For silver, from the low price of $8.88 reached in October 2008, the has returned 221.5%. Once again, palladium outshines the performance of both.

The current price of palladium represents a nine year high for the metal. The continued rise has been attributed to dwindling stockpiles in Russia amidst increased use within China for catalytic converters in gasoline powered automobiles.

Earlier this year the first palladium ETF for U.S. investors was launched by ETFS Securities, trading until the symbol PLL. More recently, a bill was introduced in the U.S. House of Representatives seeking to authorize American Palladium Eagle bullion coins.

Gold, Silver, Platinum, Palladium 2010 Second Quarter Performance

Although gold and silver are experiencing a sharp decline today, they recorded strong performance during the second quarter of 2010. Platinum and palladium both posted declines for second quarter, but maintain gains for the year to date.

The table below shows the last London Fix Price of 2009 for each metal and the last price for June 30, 2010 followed by the percentage gain or loss for the 2010 Second Quarter and the Year to Date performance.

2009 Close June 30, 2010 Close 2nd Quarter YTD
Gold $ 1,087.50 $ 1,244.00 11.52% 14.39%
Silver $ 16.99 $ 18.74 7.09% 10.30%
Platinum $ 1,461.00 $ 1,532.00 -6.87% 4.86%
Palladium $ 393.00 $ 446.00 -6.89% 13.49%

Gold recorded the largest gain for the most recent quarter with an increase of 11.52%. It is also showing the strong performance out of the four metals for the year to date, up 14.39%. During 2009, the other three metals had outperformed gold by wide margins.

Silver posted a gain of 7.09% for the quarter and is up 10.30% for the year to date. Notably, silver has now posted a gain for the past six consecutive quarters. This represents the longest quarterly winning streak which took place through the beginning of 1980 when silver had eleven consecutive quarters of gains.

Platinum and palladium showed declines of 6.87% and 6.89% for the quarter. Year to date numbers remain positive at 4.86% and 13.49%.

Measuring Declines from the High- Gold, Silver, Platinum, Palladium

For the past few weeks, precious metals have undergone significant, rapid declines. This follows a year of banner performance during 2009. I wanted to take a post to briefly examine the extent of the declines for gold, silver, platinum, and palladium.

Roughly two months ago, gold had reached a new all time high and silver had reached its highest level going back about twenty months. Less than three weeks ago, platinum and palladium had reached their highest levels in about sixteen months.

The figures below show the recent high compared to the recent low and the extent of the decline. All figures are London PM Fix.

Gold

Recent High: $1,212.50 (December 2, 2009)
Recent Low: $1,058.00 (February 5, 2010)
Decline: -$154.50 (-12.74%)

Silver

Recent High: $19.18 (December 2, 2009)
Recent Low: $15.14 (February 8, 2010)
Decline: -$4.04 (-21.06%)

Platinum

Recent High: $1,627.00 (January 20, 2010)
Recent Low: $1,475.00 (February 5, 2010)
Decline: -$152.00 (-9.34%)

Palladium

Recent High: $462.00 (January 21, 2010)
Recent Low: $395.00 (February 5, 2010)
Decline: -$67.00 (-14.50%)