March 28, 2024

Gold and Silver ETF Holdings Mixed Amidst Price Decline

Over the past week, gold holdings in the SPDR Gold Shares Trust (GLD) fell, while silver holdings in the iShares Silver Turst (SLV) rose. These changes occurred amidst a decline in the price of the metals and a buoyant stock market.

The iShares Silver Trust, which represents the largest exchange traded fund backed by silver, increased by 13.85 metric tons from the previous week. Total holdings are now 10,917.19 metric tons, or 350.996 million ounces.

Holdings within the SPDR Gold Trust fell by 11.38 metric tonnes in the past week to 1,272.68. Trust holdings had reached a record high of 1,320.47 on June 29, 2010. The decline in holdings from the high is now 47.79 metric tons, or 3.6%. During the same period the price of gold has risen by more than 10%.

GLD and SLV Holdings (metric tons)

Jan 5, 2011 Weekly Change YTD Change
GLD 1,272.68 -11.38 -8.04
SLV 10,917.19 +13.85 +4.38

US Mint Sells 1,429,500 Ounces of Gold Bullion During 2010

The United States Mint sold less gold bullion during 2010 than the previous year, as measured in ounces. Across their offerings of American Gold Buffalo and American Gold Eagle bullion coins, sales reached 1,429,500 in the current year compared to 1,625,000 in the prior year.
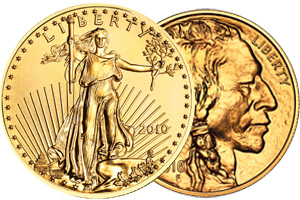
The American Gold Buffalo is struck in one ounce of 24 karat (.9999 fine) gold and carries James Earle Fraser’s classic design from the Buffalo Nickel. The 2010-dated coins were first available on April 29, 2010 and remained available for ordering by authorized purchasers until late September 2010.

The American Gold Eagles are struck in a composition of 22 karat ( .9167 fine) gold and carry the obverse design of Augustus Saint Gaudens’ classic double eagle. A range of weights are available to provide greater investment flexibility. The one ounce 2010 Gold Eagle went on sale January 19, 2010, with the one-half ounce, one-quarter ounce, and one-tenth ounce size coins on sale June 10. The coins remained on sale through the end of the year.

For the calendar year, the US Mint sold the following quantities of gold bullion coins:

Coins Total oz.
American Gold Eagle 1 oz 1,143,000 1,143,000
American Gold Eagle 1/2 oz 46,000 23,000
American Gold Eagle 1/4 oz 62,000 15,500
American Gold Eagle 1/10 oz 390,000 39,000
American Gold Buffalo 1 oz 209,000 209,000
Total 1,429,500

The drop in total ounces sold from the prior year is 195,500, representing a decline of about 12%.

Despite the drop in ounces sold, there was likely an increase for the year based on total dollar sales due to the higher price of gold. For 2010, the price of gold was up more than 27%.

Authorized purchasers are allowed to order gold bullion coins directly from the US Mint in minimum quantities of 1,000 ounces. The price paid is based on the London PM Gold Fix price following the day of order.

US Mint Sells Record 34.6 Million Silver Eagle Bullion Coins

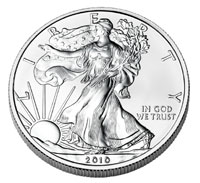
Demand for physical precious metals continues to drive United States Mint bullion sales to new heights. The American Silver Eagle bullion coins sold a record 34,662,500 coins during 2010.

The previous record for annual sales was achieved in 2009 when 28,766,500 coins were sold. This sales level was surpassed in November of this year, so the only question was how far into record territory sales would eventually extend. The final numbers for 2010 represent a rise of 20.50% from the previous record.

Each American Silver Eagle bullion coin contains one troy ounce of .999 fine silver. The coins have been offered by the United States Mint annually since 1986. By law, the coins must be issued in quantities needed to meet public demand, which means that production fluctuates from year to year to meet this target. At some times during the past three years, production has fallen short of meeting full demand, which has necessitated sales suspensions and rationing programs.

From the start of the program in October 1986 through December 31, 2010, total Silver Eagle bullion sales have reached 241,277,000.

Today, the US Mint began accepting orders from authorized purchasers for 2011 Silver Eagle bullion coins. According to the US Mint’s website, opening orders total 1,696,000, although this might include some remaining 2010-dated coins.


2010 Gold, Silver, Platinum, and Palladium Price Performance

Precious metals delivered another year of strong performance, with double digit percentage gains for gold, silver, platinum, and palladium.

Palladium led the pack with an increase of 96.77% for the year. The metal is now at a nine year high, with gains attributed to the dwindling stockpiles in Russia amidst increased demand for use within catalytic converters in gasoline powered automobiles. As recently as December 2008, the price of palladium was $164 per ounce, compared to this year’s closing price of $791.

Silver had an impressive year with a gain of more than 80%, outperforming gold’s rise of 27.74%. With the price of silver moving up faster than gold, the gold-silver ratio continues to contract. This ratio indicates the number of ounces of silver necessary to purchase one ounce of gold. At the start of the year, the ratio was 64.98. At the close of the year, the ratio is 46.04.

The table below shows the last available London Fix prices from 2009, today’s London AM Fix price, the change, and percentage change.

2010 Precious Metals Price Performance


Dec 31, 2009 Dec 31, 2010 Change Percent
Gold $1,104.00 $1,410.25 $306.25 27.74%
Silver 16.99 30.63 13.64 80.28%
Platinum 1,466.00 1,731.00 265.00 18.08%
Palladium 402.00 791.00 389.00 96.77%

Although palladium and silver outshone gold this year, gold continues its impressive streak of consecutive annual gains. The price of gold has recorded an annual gain each year since 2001. During the ten year period, the price of gold has risen more than fourfold from $272 per ounce to $1,410.