April 26, 2024

US Mint Gold and Silver Rationing Ends

The United States Mint unceremoniously ended the allocation programs which had been limiting the number of Gold and Silver Eagle bullion coins that authorized purchasers could order. The announcement came in the form of a memorandum sent to authorized purchasers on Monday.

June 15, 2009

MEMORANDUM TO ALL AMERICAN EAGLE GOLD AND SILVER BULLION
AUTHORIZED PURCHASERS

SUBJECT: American Eagle Gold and Silver One Ounce Bullion Coin Allocations

Effective immediately, the United States is lifting the allocation process.

You may place your orders under the standard ordering procedures. The ordering minimum and incremental quantities apply.

Thank you for your patience during this past year. We appreciate your continued support.

Amidst high demand for precious metals and a constrained supply of precious metals blanks, the US Mint had implemented allocation programs for Gold and Silver Eagle bullion coins. The allocation program for the American Silver Eagle began on April 21, 2008 when the price of silver was $17.88 per ounce. The allocation program for American Gold Eagle began on August 15, 2008 when the price of gold was $786.50.

The United States Mint had also taken other measures to deal the physical precious metals shortage. First, they had restricted production to only one ounce gold and one ounce silver bullion coin options. Typically a range of fractional bullion coins including 1/2 ounce, 1/4 ounce, and 1/10 ounce coins is offered. Second, they had announced the temporary delay of production for platinum bullion coins and 24 karat Gold Buffalo coins. Third, they delayed the production of gold and silver coins produced for collectors in order to divert all precious metals blanks to the production of bullion coins.

The US Mint has not announced whether production fractional bullion coins, 24 karat gold bullion coins, platinum bullion coins, and gold and silver collector coins has resumed.
Gold and Silver Eagle Shortage Becomes Surplus

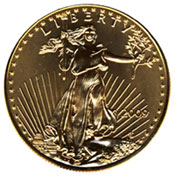
For countless months, authorized purchasers of US Mint gold and bullion coins have been subject to a rationing process, which limited the number of coins they could purchase. The rationing program had been put into place after the demand for gold and silver coins exceeded the US Mint’s ability to supply them. In a few recent posts I have provided some indications that the shortage of American Silver Eagles and American Gold Eagles might be ending. There’s yet another indication that the end of the shortage and rationing is close at hand.
Throughout the rationing period, the entire supply of coins available from the US Mint had been divvied up and sold to the authorized purchasers. For the first time since rationing began, the US Mint failed to sell their total production of Gold and Silver Eagles.

Dave Harper, the editor of Numismatic News, writes:

In the prior two weeks, the 14 purchasers authorized to buy the American Eagle coins from the U.S. Mint have not taken the maximum number of coins that are available, leaving the Mint with an extra 39,000 one-ounce gold American Eagles and 185,000 extra silver American Eagles.

To my knowledge, the rationing program for Gold and Silver Eagles still remains in place despite the surplus of recent weeks. The US Mint is likely waiting to build an inventory of bullion before attempting to remove purchasing restrictions completely.

When the rationing program was instated by the US Mint, it generated a lot of attention from blogs and news sites. The rationing was cited as evidence of the overwhelming demand for physical precious metals that would eventually carry market prices higher. With the opposite situation developing, opposite predictions have emerged.

In befuddlement to both arguments, the the disconnect between physical demand and market price continues. Amidst the unraveling of the physical scarcity situation, the prices for gold and silver have risen to multi-month highs with many predicting impending breakouts, which will carry prices even higher.

Gold and Silver Paper and Physical Markets Realign

Late last year and early this year, a continual observation of the gold and silver markets was the disconnect between the prices quoted on paper markets and the prices that you would actually need to pay to buy physical precious metals. In the past few weeks premiums for physical gold and silver have declined as the prices quoted on the paper market have risen, basically bringing the two markets back into alignment.

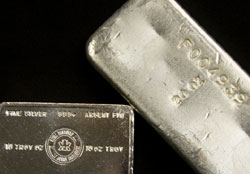
Back in October 2008, I had examined 100 ounce silver bars as an example of the excessive premiums being paid for physical precious metals. I collected some data from recently completed eBay auctions that showed the average price of the 100 ounce silver bar ranging from $1,329 to $1,557 while the market price of silver ranged from $8.88 to $10.89. This represented premiums ranging from $39.62% to 56.45%. This was particularly ridiculous since the 100 ounce silver bar has been traditionally viewed as a low premium method for silver investing.

Reviewing some data for eBay auctions completed yesterday now shows the prices paid for 100 ounce silver bars ranging from $1,450 to $1,500. At yesterday’s closing price of silver of $14.09, this represents a much more reasonable premium of about 3% to 6%.

Peculiarly, the decline in premium is a close match to the increase in price for spot silver. If you invested in silver by buying physical bars back in October, you might be showing zero profit even though the market price is up over 40%.

Future Gold and Silver Price Implications?

When the premiums for physical precious metals were high, it was viewed as a sign of heavy demand amidst a diminished supply that would eventually force market prices to move higher. Now that the disconnect between the paper and physical markets has seemingly resolved itself, is this a signal of slower demand that will lead to lower prices?

Despite the implication of slower demand, I think the realignment of the markets represents a long term positive for the price of gold and silver. Back when premiums were high, I am sure that many potential investors backed away from the market when they were faced with excessive premiums. Potential investors will now actually be able to buy physical gold and silver around the market prices. This is a much better environment for fostering mainstream demand to keep gold and silver moving higher.
[phpbay]100 ounce silver bar, 3, “”, “”[/phpbay]

Half Gram Gold Coins

The World Gold Council recently announced their plans to attempt to popularize half gram gold coins. The plan seems mostly targeted towards consumers in India, in advance of the upcoming festival.

How small is a half gram of gold? There are 31.1034768 grams in one ounce. If you are familiar with the one-tenth ounce size gold coin, a half gram of gold would be about one-sixth of that size. The value of one half gram of gold based on Friday’s gold closing price would be about $14.68.

The story about half gram gold caught my attention because it is the opposite of what’s happening with gold in other parts of the world. As the price of gold increases, it makes sense to popularize smaller size coins or bars so that a mainstream audience will continue to have options for investing in gold. In the United States, smaller sized coins have actually been suspended in favor of producing only one ounce coins.

This step was taken by the US Mint at the end of 2008. At least one other world mint that I follow, took similar action. For all of 2009, the US Mint has only produced gold bullion coins in the one ounce size. Based on the current price of gold plus the standard markup, the price tag for the smallest possible gold purchase approaches $1,000. This may be out of reach for many potential investors.

In advance of Y2K, there was a renewed interest in precious metals investing as a disaster hedge. Even mainstream consumers began to buy into the story, bringing in many new gold investors with budgets both large and small. When Y2K precious metals investment reached its peak in 1999, the US Mint sold 2,750,338 1/10 ounce gold coins which would have cost around $40 each. The 275,000 ounces sold via 1/10 ounce coins actually exceeded the total amount of gold bullion sold by the US Mint for some prior years.

The current lack of fractional sized bullion coins has effectively cut off a significant portion of gold investment demand. Importantly, this is demand which would come from a mainstream investment audience, which gold currently lacks.

Gold, Silver & Platinum 2009 First Quarter Performance

With the first quarter at an end, let’s take a look at the performance of gold, silver, and platinum so far this year.

When putting the numbers together, I knew what to expect, but its still surprising to see where the final numbers landed. Gold, silver, and platinum’s performance relative to one another has basically been turned upside down from the 2008 annual performance.

2009 First Quarter Gold, Silver, and Platinum Performance
30-Dec-08 31-Mar-09 Change Percent
Gold 869.75 916.50 46.75 5.38%
Silver 10.79 13.11 2.32 21.50%
Platinum 898.00 1,124.00 226.00 25.17%

For 2008, gold had performed the best with a gain of 4.32%, followed by silver with a loss of 26.90%, with platinum in last place with a loss of 41.31%.

As you can see the performance for the first quarter of 2009 has been the opposite with platinum performing best with a gain of 25.17%, followed by silver with a gain of 21.50%, with gold in last place with a gain of 5.38%.

Platinum and silver were in some respects recovering from the beating they took last year. Over the past several years gold has emerged as more of a steady performer, as compared to the more volatile performance of the other metals, commodities, equities, real estate, etc. It’s ironic that whenever a mainstream publication discusses the possibility of investing in gold, they never fail to caution about gold’s “volatile” prices.

At any rate, precious metals outperformed stocks for the quarter, mostly by a wide margin. The Dow, S&P 500, and Nasdaq lost 14.29%, 12.81%, and 3.07% respectively.

What Can Google Trends Tell Us About Gold?

Every now and then I find myself playing around with Google Trends. For anyone who hasn’t tried it before, it’s a Google product in the early stages of development that allows you to see historic search volume trends for given search terms. When I recently ran some gold related searches, I came up with some interesting results.

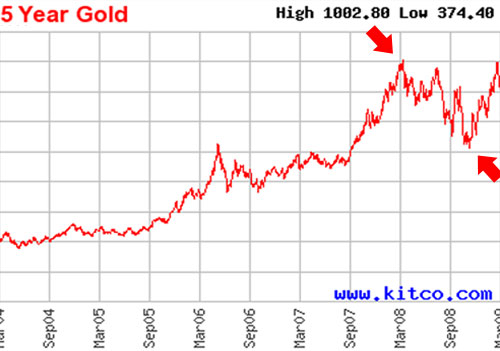
Here are the results for the search volumes for “Sell Gold” and “Buy Gold” followed by a chart of gold scaled to align. I added the red arrows to emphasize the extremes.

The large spike in search volume for “Sell Gold” appeared just as gold was hitting its peak. Similarly, there was a spike of search volume for the term “Buy Gold” just as gold reached an intermediate low. The broad, aggregated intent of internet searchers as determined by Google Trends called the exact high and low for gold. Maybe Google Labs has created a perfect communicator for the “wisdom of internet searches.”

What does the internet crowd say about gold’s run to $1,000 and subsequent fall back to the $900 level? The response seems mixed. There were small increases in both the “Buy and “Sell” searches that don’t seem to suggest strong conviction in either direction. I have a feeling that the Google Trends indicator might work well for extremes or broad trends, but not so well for other situations.

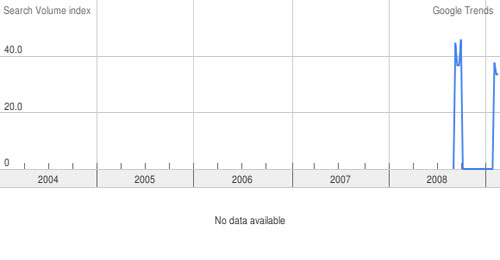
To finish, here’s one final Google Trends search that is worth noting. Below are the results for “Gold Investment.” If a search term does not have sufficient search volume, data is not displayed. “Gold Investment” finally received enough searches to show up around September 2008 and once again in February 2008. Is investing in gold starting to go mainstream?

Analysts Pile on the Gold Bull

Gold’s recent move above $900 has analysts scrambling to increase their price targets.

The last time I looked at gold price targets from analysts was in early December, when a similar flurry of activity took place. Morgan Stanley got the ball rolling by saying that gold could reach $1,000 in three years, Merrill Lynch followed with a price of $1,500 at an unspecified date, and Citigroup topped them all by mentioning $2,000.

This time around started in the same way with Morgan Stanley making a timid call for $1,075 gold in three years. From their report: “A globally synchronous and aggressive fiscal and monetary stimulus may be needed to re-inflate the global economy, and we think this continues to present significant upside to gold prices.” For their rhetoric, their target price is ridiculous, unless you consider “significant upside” to be a 6% annual gain for three years.

Merrill Lynch chimed in next with their Chief Investment Officer reiterating their prediction of $1,500 gold, but this time with a time frame of 12 to 15 months. Quote from the CIO: “With confidence in currencies shaken to the core, the yellow metal is increasingly assuming the role of “the most trusted currency. We have never seen such a rush to buy gold. It’s bringing in security and it’s still affordable.”

A few days following, both UBS and Goldman Sachs updated their previously underwater gold price targets. UBS raised their 2009 price target from $700 to $1,000. Goldman Sachs raised its forecast of $700 to $1,000 within a three month time frame.

As expressed before, I do not think we have reached the point where these periodic analyst pile ons can be used as a contrary indicator for gold. Analysts are still showing restraint, and for the most part raising their targets simply to keep up with the rising price of gold.

Actions of the US Mint Discourage Gold Ownership

Over the past several months, the United States Mint has announced a series of actions and policy changes that make it more difficult for the average individual to buy gold. There have always been plausible or semi-plausible explanations, but the consequence of each action has been to limit or discourage gold ownership.

The recent actions of the United States Mint in relation to gold are presented below. I have also included the US Mint’s explanation for each situation, taken from official memorandums or press releases.

August 2008: The US Mint suspends sales of Gold Eagle bullion coins. Sales resume two weeks later on a rationed basis.

On August 14, 2008, the US Mint announced that they were suspending sales of American Gold Eagle bullion coins. The suspension was in place until August 25, 2008, when sales resumed under an allocation program. The program divides available gold coins into two pools. The first pool is divided equally among all authorized bullion purchasers. The second pool is allocated based on past sales performance.

When gold coin rationing (termed “allocation”) was introduced, it was presented as a temporary measure. More than four months later, gold coin rationing continues. There has been no indication when authorized bullion purchasers will be able to order unrestricted quantities of gold bullion coins.

US Mint explanation:

“The unprecedented demand for American Eagle gold one-ounce bullion coins necessitates our allocating these coins among the authorized purchasers on a weekly basis until we are able to meet demand.”

September 2008: The US Mint suspends sales of Gold Buffalo bullion coins. Sales resume more than one month later, but only to clear remaining inventory.

On September 25, 2008, the US Mint announced the sales suspension of 24 karat American Gold Buffalo bullion coins. Sales did not resume until November 2, 2008 when the US Mint was able to offer only its remaining limited inventory on an allocated basis.

US Mint explanation:

“Demand has exceeded supply for American Buffalo 24-Karat Gold One-Ounce Bullion Coins, and our inventories have been depleted. We are, therefore, temporarily suspending sales of these coins.”

October 6, 2008: The US Mint announces that production will be halted for all but one gold bullion coin option.

Production was immediately halted for one-half ounce and one-quarter ounce American Gold Eagle bullion coins. Production of one tenth-ounce gold bullion coins was halted following depletion of the remaining blank supplies. Production of one ounce Gold Buffalo bullion coins was also halted following depletion of the remaining blank supplies.

These coins represent the US Mint’s only fractional gold bullion coin offerings and the US Mint’s only 24 karat gold bullion offering. The production halt seemed to be a temporary measure that would impact 2008 dated coins. The production halt has continued into 2009. There has been no indication when production will resume.

US Mint explanation:

“The United States Mint has worked diligently to attempt to meet demand, however, blank supplies are very limited and it is necessary for the United States Mint to focus remaining bullion production primarily on American Eagle Gold One Ounce and Silver One Ounce Coins.”

November 10, 2008: The US Mint announces the discontinuation of numerous gold and platinum numismatic products.

The discontinuation of 22 different gold and platinum numismatic products was included as a broader measure to refocus the US Mint’s line of products for coin collectors. Discontinued gold coin products included fractional uncirculated Gold Buffalo coins, one ounce uncirculated Gold Buffalo coins, fractional proof Gold Buffalo coins, and fractional uncirculated Gold Eagle coins.

Although the US Mint has constantly referred to the “unprecedented demand” for gold, they deemed their gold numismatic products to be “unpopular.” Following the discontinuation announcement, sales of the 2008-dated versions of the discontinued coins surged and all numismatic Gold Buffalo and platinum coin offerings sold out in less than a month.

US Mint explanation:

“We are responding to the collector community which has spoken loudly and clearly. Customers have told us there are just too many products.  We agree, and it’s time the United States Mint trims down and concentrates on the products our customers love most.”

November 24, 2008: The US Mint announces the delayed release of all but one 2009 gold bullion coin option.

This delayed release served to prolong the previously announced production halts for fractional gold bullion coins and the 24 karat Gold Buffalo bullion coins. As noted previously, the production halt continues with no indication of when it might end.

The single 2009 gold bullion offering from the US Mint continues to be subject to rationing. As noted previously, there has been no indication of when the rationing will end.

US Mint statement:

“The quantities of blanks that we have been able to acquire from our suppliers continue to be very limited, while demand for bullion coins remains high. As a result, it is necessary for the United States Mint to delay the launch of other bullion coins until later in 2009. We will continue to monitor the situation and keep you informed as additional information becomes available.”

January 6, 2009: The US Mint establishes a new pricing policy for gold and platinum numismatic products.

The new US Mint pricing policy adjusts the prices for gold and platinum numismatic products as often as weekly based on the average London AM Fix gold price. The prices for coins are based on a published table which seems to impute higher premiums than the old pricing system.

In the past, prices were established at the start of sales and remained fixed unless there was a significant move in the price of the underlying precious metal. At times gold numismatic products could be purchased for premiums as low as 10%. Under the new policy, prices are adjusted weekly to preserve permanently high premiums. Current premiums run 30% or more depending on the product.

US Mint explanation:

“Transparency, agility, and customer service are the catalysts for our new pricing method. The volatile precious metals market prompted our customers to suggest that we re-vamp our process, and we listened.”

Conclusion?

The series of incremental changes outlined above has resulted in the following situation:

  • Production was halted for all of the US Mint’s fractional gold bullion and 24 karat gold bullion offerings several months ago. There has been no indication when production might resume.
  • The only 2009 gold bullion coin available from the US Mint is the one ounce American Gold Eagle. Sales of this single bullion coin offering remain subject to rationing.
  • The US Mint’s gold numismatic offerings for 2009 have been significantly reduced from the prior year. The remaining product offerings will be priced at prohibitively high premiums under a newly established pricing policy.

Whether or not it was the US Mint’s intention, every significant action they have taken since August has either limited gold availability, eliminated gold product options, or increased the cost of acquiring gold. Has it all just been a consequence of surging global demand for gold, supply chain mismanagement, and bad timing for policy decisions? Or is there something else going on here?

Thank you to APMEX for confirming the status of the US Mint’s 2009 gold bullion coins for this post.

2008 Gold, Platinum & Silver Performance

As trillions of dollars in equity values were vaporized this year, a strong November and December performance pushed gold into positive territory by year end. Gold’s annual gain was 4.32%. This marks gold’s eighth consecutive annual gain. The “lost decade” for stocks, has been quite the opposite for gold. Silver and platinum were less fortunate, posting losses of 26.90% and 41.31% respectively.

(Figures calculated from Kitco’s London PM Fix prices)

The headline numbers only tell part of the story. I rounded up a bit more data which paints a more complete picture of the 2008 performance of gold, silver, and platinum.

Gold Silver Platinum
Dec 31, 2007 Close 833.75 14.76 1530.00
Dec 31, 2008 Close 869.75 10.79 898.00
Annual Change +36.00 -3.97 -632.00
Percentage Change +4.32% -26.90% -41.31%
2008 Low 712.50 8.88 763.00
Change from start to low -121.25 -5.88 -767.00
Percentage Change -14.54% -39.84% -50.13%
2008 High 1011.25 20.92 2273.00
Change from start to high +177.50 +6.16 +743.00
Percentage Change +21.29% +41.73% +48.56%

The first section of the table above shows the performance of gold, silver, and platinum from start to finish during 2008. The second section lists the lowest closing price for each metal during 2008, and calculates the percentage change from the start of the year to the low price. The final section lists the highest closing price for each metal during the year, and the percentage change from start of the year to the high price.

Some observations:

Often when the mainstream press writes about gold as a potential investment option, they usually caution that prices are “extremely volatile.” A look at the figures above shows otherwise. While it seemed like a year of extremes for gold, at its lowest it was down 14% and at its highest it was up 21%, probably making it one of the least volatile investments of 2008.

Platinum, which is starting to draw my interest, basically went straight up during the month of February to its peak price of $2,273 per ounce. Then it experienced three months of nearly continuous declines from mid-July to mid-October where it reached its low of $743 per ounce. At its high it was up nearly 50%, at its low it was down more than 50%. Briefly, the price of gold exceeded the price of platinum, but the situation has now reverted to the norm.

Silver experienced a similar plight, up more than 40% at its peak and down more than 40% at its low. The period of decline also took place from mid-July to mid-October. Many have pointed to the enormous concentrated short position taken by a handful of banks in July as responsible for the decline.

On a housekeeping note:

Sorry for the lack of posting on Gold and Silver Blog during the end of December. I should be back on a regular schedule for the new year. I aso plan to add some new sections to the site, which compile historical data relevant to gold and silver watchers. Thanks for reading and let’s make 2009 a great year!

Two Milestones for Gold

In the past week, gold quietly marked two important milestones.

First, as of Monday the price of gold is now showing a gain for the year. The closing price of gold on December 31, 2007 was $833.75. The price of gold today is $854.60.  That makes gold up 2.5% for the year to date. If gold can hang onto this gain into the end of the year, this will also mark the eighth year in a row that gold has had a positive return. For the year and for this decade, gold has humbled its naysayers and rewarded its investors.

Second, on Tuesday the price of gold exceeded the price of platinum. The two metals now trade within a few dollars of each other with gold at $854.60 and platinum at $858. This is a big change from earlier in the year when platinum was trading over $2,200 per ounce, more than double the price of gold. If I’m not mistaken, the price of platinum has been higher than the price of gold for this entire decade. Not since the 1990’s has gold been more expensive than platinum. Considering that platinum is thirty times scarcer than gold, this makes a strong statement about the demand for gold.