April 29, 2024

Silver Soars to 30 Year High as Precious Metals Resume Upwards Trends

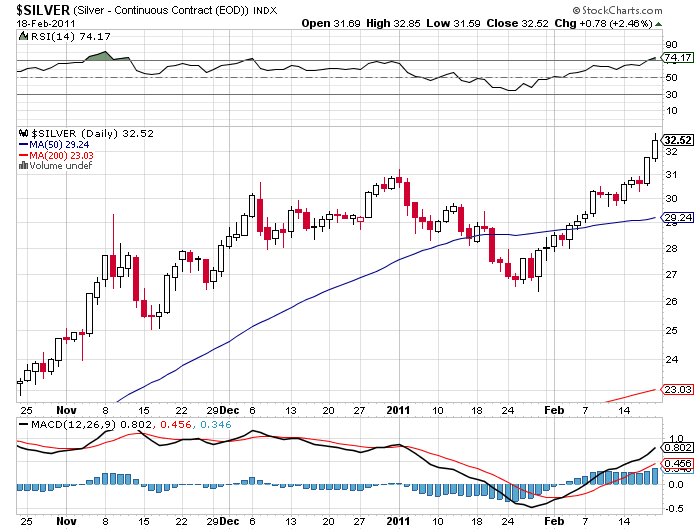
After a brief consolidation below the 50 day moving average in late January, silver resumed its uptrend with a vengeance.  The London PM fix price for silver closed at $31.94 up from $30.00 the previous week.  Since late January, silver has rocketed $5.50  for over a 20% gain.

Silver - courtesy stockcharts.com

The fruitless budget reduction talks in Washington, a slide in the US Dollar Index and a new high on silver are certain to ignite the precious metal markets into another major move upwards.  Most investors under the age of 50 probably don’t remember the last time silver prices have soared past $30 in the early 1980’s.

Technically and fundamentally, silver is poised to make a major move.  Price movements coming out of long bases usually have a long duration.   Silver has broken out from an ultra long base of over 25 years.  The initial move from the $5 area to $30 is simply the first phase of what should turn out to be a major upward move.

Long term silver

Silver hit an all time high of $48.70 in January 1980.  The inflation adjusted historical high for silver is $130 per ounce.  Considering the horrendous manner in which sovereign states are conducting their financial affairs and the potential for another financial crisis, the inflation adjusted high of $130 will look like a bargain price at some future date.

The closing London Fix Prices showed gains across the board from the previous week.  Silver was the standout performer with a gain of 6.5%.

Precious Metals Prices
Fri PM Fix Since Last Recap
Gold $1,383.50 +19.50 (+1.43%)
Silver $31.94 +1.94 (+6.46%)
Platinum $1,836.00 +7.00 (+0.38%)
Palladium $847.00 +25.00 (+3.04%

Gold and Silver Recap: Back to Work

Another Precious Week

So the holiday season, with decent job creation statistics, has seen some uncustomary cheer for the dollar, and on the face of it this seems to be the main driver for the weakness of gold and silver prices.  After all if you’re priced in dollars, and the dollar goes up then your price goes down.  The last week has been particularly bad for gold, with a 3.5% fall (the figures below cover the whole of the holiday period) which is the largest week on week fall for six months.

The long term trend still looks like it’s going to be up, as the Central Banks are starting to buy gold, apart from the Fed – although if Ron Paul gets his way then Uncle Sam may stop being a hold out as well.

Precious Metals Prices
Fri PM Fix Since Last Recap
Gold $1,367.00 -1.50 (-0.11%)
Silver $28.39 -0.39 (-1.36%)
Platinum $1,735.00 +39.00 (+2.30%)
Palladium $754.00 +16.00 (+2.17%)

Gold-Silver Ratio: 48.15 (was 47.55)

So far the Central Banks that are buying gold are the scary ones; Russia, China and Venezuela.  But one of the more interesting things is that they are doing this in secret.  If it was an attempt to finish off the dollar then this would be in the open.  No, they are seeing gold as an integral, and underweight part of the reserves that are going to underpin their currencies in the future.  In other words an unofficial, secretive return to the gold standard.  This sort of thing is not a long run dampener on the gold price.

Silver also did badly, which was shown in a rather big slip in the gold silver ratio.  If the idea is that silver is priced around a third of its long term price when compared to gold, well it shouldn’t be going in this direction.  Now I don’t fully buy the idea that silver has got to come to around fifteen ounces to an ounce of gold, or at least any time soon.  But it hard to deny that it is out of balance.

What is even odder is that platinum and palladium have seen a large rise over the holiday period.  While gold can have a life of its own, and it’s true that palladium can have more to do with what the Russian ministry of mines is up to, silver and platinum are quite similar.  While platinum and palladium have seemed to be riding the same industrial metal climb as copper, silver seems to have decoupled with the feeling that perhaps we’ve overestimated the inflationary potential for the dollar with the classic inflation hedge of silver taking the hit.

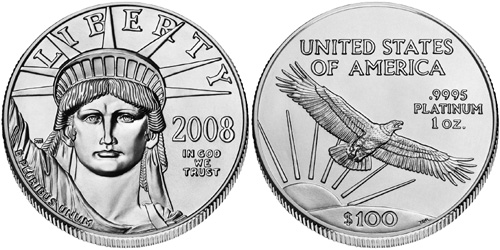
US Mint Platinum Bullion Coins a No-Show for 2010

For the second year in a row, the United States Mint did not offer platinum bullion coins for precious metals investors. Bullion products available from the US Mint during 2010 included only gold and silver coins.

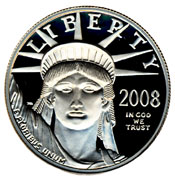
The American Platinum Eagle was last available to the US Mint’s network of authorized purchasers in November 2008 when the last 800 one-half ounce coins available had been sold. Immediately following the sell out, the Mint announced the delayed launch of 2009-dated bullion coins, including the Platinum Eagles.

Since that time, Platinum Eagle bullion coins have not been available in any format. When the coins were previously available, authorized purchasers were able to buy the coins from the Mint based on the market price of platinum plus a mark up of 4%, 6%, 10%, and 15% for one ounce, one-half ounce, one-quarter ounce, and one-tenth ounce bullion coins. Of the United States Mint’s eleven authorized purchasers, five are approved to order platinum coins.

Collector versions of the American Platinum Eagle have been available for the past two years in limited quantities. The one ounce 2009 Proof Platinum Eagle went on sale December 3, 2009 and sold out of the maximum authorized mintage of 8,000 coins within a week.The coins were priced at $1,792 each.

The 2010 Proof Platinum Eagle was offered on August 12, 2010 with a maximum mintage of 10,000. Priced at $1,892 each, these coins also sold out in about a week.

Will the US Mint release 2011 Platinum Eagle bullion coins? Or will the coins fail to make an appearance for the third year in a row?

Platinum Price Underperforms Gold, Silver, and Palladium

In what has been a strong year for precious metals, platinum is showing only a modest gain of 13.35% for the year to date. This is below the gains experienced for gold and silver, and far below the nearly 75% gain for palladium.

After peaking at $2,273 per ounce in March 2008, platinum dropped precipitously to a low of $763 per ounce by October of the same year. While other precious metals have reattained their 2008 high water marks and then some, platinum has lagged behind.

Gold, Silver, Platinum, and Palladium Performance (London Fix Prices)

Dec 31, 2009 Nov 18, 2010 Change Percent
Gold 1,087.50 1,350.25 262.75 24.16%
Silver 16.99 26.57 9.58 56.39%
Platinum 1,461.00 1,656.00 195.00 13.35%
Palladium 393.00 684.00 291.00 74.05%

The relative under performance of platinum compared to palladium can be explained by the supply and demand situation. While platinum is forecast to be in a surplus of 290,000 ounces for the year, palladium will be in a deficit of around 200,000 ounces. There has been more demand for palladium, which is used in catalytic converters for gas powered automobiles, than platinum, which is used in diesel devices. Palladium recently hit a nine year high above $700 per ounce.

The ratio between the price of platinum and palladium is 2.42, which is the lowest ratio is more than seven years.

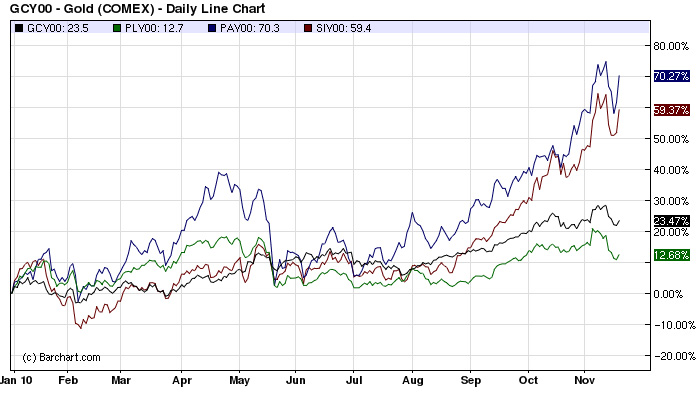
Gold, Silver, Platinum, Palladium Chart (COMEX Prices)

Gold and silver prices have benefited from strong demand from investors. Global fiscal imbalances and currency tensions have brought attention to these metals’ historic status as stores of value and inflation hedges. Due to platinum’s predominantly industrial uses and the supply surplus noted, it has not been as significant a beneficiary.

The price difference between platinum and gold is currently $305.75. When platinum reached its peak price in March 2008, the difference had expanded to $1,289. The metals traded close to parity in mid-December 2008.

Gold, Silver, Platinum, Palladium 2010 Second Quarter Performance

Although gold and silver are experiencing a sharp decline today, they recorded strong performance during the second quarter of 2010. Platinum and palladium both posted declines for second quarter, but maintain gains for the year to date.
The table below shows the last London Fix Price of 2009 for each metal and the last price for June 30, 2010 followed by the percentage gain or loss for the 2010 Second Quarter and the Year to Date performance.

2009 Close June 30, 2010 Close 2nd Quarter YTD
Gold $ 1,087.50 $ 1,244.00 11.52% 14.39%
Silver $ 16.99 $ 18.74 7.09% 10.30%
Platinum $ 1,461.00 $ 1,532.00 -6.87% 4.86%
Palladium $ 393.00 $ 446.00 -6.89% 13.49%

Gold recorded the largest gain for the most recent quarter with an increase of 11.52%. It is also showing the strong performance out of the four metals for the year to date, up 14.39%. During 2009, the other three metals had outperformed gold by wide margins.

Silver posted a gain of 7.09% for the quarter and is up 10.30% for the year to date. Notably, silver has now posted a gain for the past six consecutive quarters. This represents the longest quarterly winning streak which took place through the beginning of 1980 when silver had eleven consecutive quarters of gains.

Platinum and palladium showed declines of 6.87% and 6.89% for the quarter. Year to date numbers remain positive at 4.86% and 13.49%.

Measuring Declines from the High- Gold, Silver, Platinum, Palladium

For the past few weeks, precious metals have undergone significant, rapid declines. This follows a year of banner performance during 2009. I wanted to take a post to briefly examine the extent of the declines for gold, silver, platinum, and palladium.

Roughly two months ago, gold had reached a new all time high and silver had reached its highest level going back about twenty months. Less than three weeks ago, platinum and palladium had reached their highest levels in about sixteen months.

The figures below show the recent high compared to the recent low and the extent of the decline. All figures are London PM Fix.

Gold

Recent High: $1,212.50 (December 2, 2009)
Recent Low: $1,058.00 (February 5, 2010)
Decline: -$154.50 (-12.74%)

Silver

Recent High: $19.18 (December 2, 2009)
Recent Low: $15.14 (February 8, 2010)
Decline: -$4.04 (-21.06%)

Platinum

Recent High: $1,627.00 (January 20, 2010)
Recent Low: $1,475.00 (February 5, 2010)
Decline: -$152.00 (-9.34%)

Palladium

Recent High: $462.00 (January 21, 2010)
Recent Low: $395.00 (February 5, 2010)
Decline: -$67.00 (-14.50%)

2009 Precious Metals Performance: Gold, Silver, Platinum, Palladium

Precious metals delivered a strong performance during 2009 with strong returns across the major categories of gold, silver, platinum, and palladium. Although gold seemed to dominate the attention of the mainstream press, the annual performance figures reveal that it was outperformed by other precious metals.

The table below displays the last price of 2008 from Kitco’s historical charts and the last price of 2009. The change and percentage change are computed below.

2009 Precious Metals Performance

Gold Silver Platinum Palladium
Last 2008 Price 869.75 10.79 898.00 183.00
Last 2009 Price 1,087.50 16.99 1,461.00 393.00
Change 217.75 6.20 563.00 210.00
Percentage Change 25.04% 57.46% 62.69% 114.75%

As seen above the surprising winner for the year was palladium, which delivered a return of 114.75%. This was followed by platinum with 62,69%, silver with a gain of 57.46%, and lastly gold with a gain of 25.04% recorded.

In some respects the out performance of palladium, platinum, and silver are simply making up for ground that was lost during 2008 (2008 Precious Metals Performance). Last year palladium had fallen by nearly 50%, platinum by about 40%, and silver by 26%. During the same period, gold recorded a small gain of 4.32%.

One of the recent characteristics of gold has been its steady upward march, defying panics in other asset classes, and general declines in commodities. This year marks gold’s ninth annual gain, which has brought the price of gold 291% higher from the end of 2000 until the end of 2009.

Gold and Silver Eagle Bullion Sales June 2009

The US Mint’s sales of gold and silver bullion coins during June 2009 showed increases from both the prior month and year ago levels. The increases came amidst two interesting developments for the US Mint’s bullion coin programs.
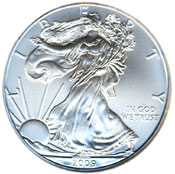
In the middle of the month, the US Mint announced that their long standing rationing programs would be lifted. Authorized purchasers of bullion coins had been limited in the total number of coins that they could order. This had been cited by many as a sign of the high physical demand for precious metals which would eventually drive prices higher.

Later in the month, the US Mint made the seemingly contradictory announcement that the American Gold Buffalo bullion coin offering would be canceled for 2009. This had been the US Mint’s 24 karat gold bullion coin, launched in 2006 as a way of competing with other world mints that produced gold coins with greater fineness than the 22 karat Gold Eagle.

Here’s a look at the US Mint’s gold, silver, and platinum bullion sales during the month of June 2009. A year to date total appears in the last column.

June 2009 US Mint Bullion Sales
1 oz. 1/2 oz. 1/4 oz. 1/10 oz. Total oz. YTD Total oz.
Gold Eagle 116,000 116,000 670,000
Silver Eagle 2,245,000 2,245,000 13,824,500
Platinum Eagle

Sales of the Gold Eagle were still confined to only the one ounce bullion coin. A total of 116,000 ounces were sold, which was close to double the prior month’s sales of 65,000 ounces. This also marks a huge increase from the year ago period when only 15,500 ounces of gold were sold. It’s interesting to note that the sales increase comes amidst a down month for gold. Physical gold buyers have tended to increase purchases during period of price decline and curtail purchases during periods of price appreciation.

Sales of the Silver Eagle reached 2,245,000 ounces. This was an increase from the prior month when 1,904,500 ounces were sold and an increase from the year ago period when 1,735,500. With the year now half completed, the American Silver Eagle remains on pace to exceed last year’s record sales of 19,583,500 ounces.

Once again, the US Mint did not offer the Platinum Eagle bullion coin in any size.

Gold, Silver & Platinum 2009 Second Quarter Performance

With the second quarter behind us, let’s take a look at the performance of gold, silver, and platinum for the second quarter of 2009 and year to date.

All of the metals posted gains, but at single digit levels. The best performer for the second quarter was silver with a gain of 6.33%, followed by platinum with a gain of 5.52%, and then gold with a gain of 1.96%. The closing numbers don’t tell the full story. At the beginning of June, precious metals prices had spiked. At this recent peak, silver had been up as much as 22% for the quarter. Platinum and gold were also showing heftier gains at this time.

2009 Second Quarter Gold, Silver, and Platinum Performance
31-Mar-09 30-Jun-09 Change Percent
Gold 916.5 934.50 18.00 1.96%
Silver 13.11 13.94 0.83 6.33%
Platinum 1,124.00 1186.00 62.00 5.52%

On a year to date basis, the top precious metal performer remains as platinum with a gain of 32.07% on the year. This is followed by silver with a gain of 29.19% and gold with a gain of 7.44%. The performance of the metals had lined up in the same manner at the close of the first quarter.

2009 YTD Gold, Silver, and Platinum Performance
30-Dec-08 30-Jun-09 Change Percent
Gold 869.75 934.50 64.75 7.44%
Silver 10.79 13.94 3.15 29.19%
Platinum 898.00 1186.00 288 32.07%

Platinum ETF and Palladium ETF Coming Soon?

ETF Securities USA recently filed with the SEC to launch exchange traded funds covering platinum and palladium. There are currently no exchange traded funds covering these metals available in the United States.

The same firm already offers ETFs for platinum and palladium which trade in Europe. According to the Wall Street Journal, the platinum holdings for the ETF approach 500,000 ounces.

Rumors of a platinum ETF for the US market briefly made the rounds back in May 2007 after the launch of the European ETFs. The rumors were quickly squelched as it was viewed as unlikely that the SEC would approve such a listing. At the time, the world’s largest platinum producers were reportedly unsupportive of the idea and pressure from the US auto lobby against the ETF was viewed as likely.

With platinum more than 50% off its peak and auto manufacturers dealing with larger issues, there doesn’t seem to be as much resistance this time around.

Here you can view the SEC filings for the proposed platinum and palladium ETFs. The filings indicate that the price per share would be equal to the value of one-tenth of an ounce of each metal.Today, platinum traded at $1,175 and palladium traded at $231. The filings include world supply and demand figures for the metals for the past ten years. In 2008, reported supply exceeded reported demand for both platinum and palladium.

The ETFs would be launched at a time when obtaining physical platinum and palladium for investment continues to be difficult or at high premiums. In order to buy physical platinum in coins or bars, premiums can be $100 or more – if you can find them. The US Mint delayed the 2009 launch of their platinum bullion product the Platinum Eagle. This delay has continued without any update. Physical palladium for investment is usually obtained in bars. The Royal Canadian Mint briefly offered the Palladium Maple Leaf from 2005 to 2007, but ended the program due to low demand.