May 17, 2024

Gold Coin Shortage and Sales Trends, Dollar-Gold Relationship

With gold fluctuating around the $900 level, let’s take a look at some thought provoking gold and silver related stories from various blogs and news sites.

Jim Rogers Interview

Incredibly, he claims that there is no shortage of gold and silver coins.

What happened was all the dealers went and bought huge silver supplies back when silver was at $20 and now their stuck and they don’t want to take a loss and so they are telling people they don’t have coins. I promise you sir if you offer $25 for silver coins you’d get all you wanted. There is no shortage.”

He goes on to say the same thing about gold coins.

Gold Coin Shortage Likely To Become Chronic

And here’s the more popular conclusion- Yes, there is a gold coin shortage. This is supported by anecdotal evidence, gold coin rationing by world mints, and high prices paid for physical gold and silver in liquid markets.

APMEX Gold and Silver Sales Data

Some first hand sales data from precious metals dealer APMEX. From 2007 to 2008 the number of orders for gold increased 262% and the number of orders for silver increased 358%.

With economy tanking, ‘liberty’ coins made of silver are paying off

Remember the Liberty Dollar? It seems that in commerce, most vendors are more than happy to take them in lieu of paper money.

Where Do You Keep Your Gold?

If you are hoarding physical gold, where do you keep it? Here’s an examination of the pros and cons of various methods of gold storage.

Dollar Gold Correlation

Briefly the US Dollar and Gold had a price correlation of 100%, taking into consideration the prior 15 trading days. The odd correlation has recently reversed sharply.

What Can Google Trends Tell Us About Gold?

Every now and then I find myself playing around with Google Trends. For anyone who hasn’t tried it before, it’s a Google product in the early stages of development that allows you to see historic search volume trends for given search terms. When I recently ran some gold related searches, I came up with some interesting results.

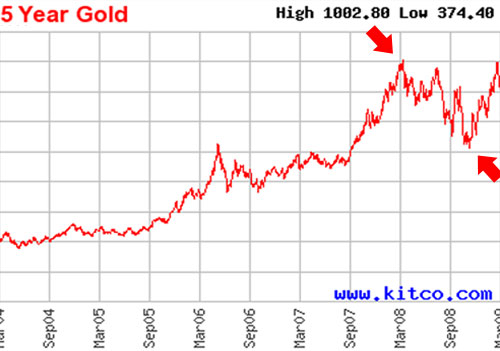
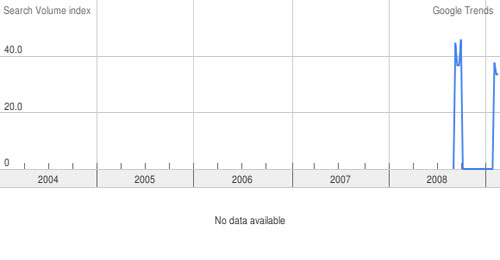
Here are the results for the search volumes for “Sell Gold” and “Buy Gold” followed by a chart of gold scaled to align. I added the red arrows to emphasize the extremes.

The large spike in search volume for “Sell Gold” appeared just as gold was hitting its peak. Similarly, there was a spike of search volume for the term “Buy Gold” just as gold reached an intermediate low. The broad, aggregated intent of internet searchers as determined by Google Trends called the exact high and low for gold. Maybe Google Labs has created a perfect communicator for the “wisdom of internet searches.”

What does the internet crowd say about gold’s run to $1,000 and subsequent fall back to the $900 level? The response seems mixed. There were small increases in both the “Buy and “Sell” searches that don’t seem to suggest strong conviction in either direction. I have a feeling that the Google Trends indicator might work well for extremes or broad trends, but not so well for other situations.

To finish, here’s one final Google Trends search that is worth noting. Below are the results for “Gold Investment.” If a search term does not have sufficient search volume, data is not displayed. “Gold Investment” finally received enough searches to show up around September 2008 and once again in February 2008. Is investing in gold starting to go mainstream?

February 2009 US Mint Gold, Silver, and Platinum Bullion Sales

Another month has gone by already, so let’s take a look at the US Mint’s bullion sales for the month of February.

As an indicator of demand the bullion sales are not as useful as they used to be. This is because the US Mint continues to ration sales of one ounce Silver Eagles and one ounce Gold Eagles due to heavy demand and low supplies of blanks. They still have not begun production or sales of fractional gold bullion coins, their 24 karat gold bullion coin, or platinum bullion coins.

February 2009 US Mint Bullion Sales
1 oz. 1/2 oz. 1/4 oz. 1/10 oz. Total oz.
Gold Eagle 113,500 113,000
Gold Buffalo
Silver Eagle 2,125,000 2,125,000
Platinum Eagle

The total ounces of gold sold during February 2009 was 113,500. That was up from the prior month when 92,000 ounces were sold and way up from the year ago period when 27,500 ounces were sold. If the current pace continues the US Mint will be on track to sell over one million ounces during 2009.

The total ounces of silver sold for February 2009 was 2,125,000. This is up from the prior month total of 1,900,000 ounces. In the year ago period only 200,000 ounces of silver were sold due to a lengthy sales suspension.

As mentioned, the suspension of platinum bullion coin production continued through February 2009.

2009 Ultra High Relief Gold Double Eagles: US Mint Can’t Deliver Their Own Hype

Back in December, I examined the upcoming 2009 Ultra High Relief Double Eagle Gold Coin offering from the US Mint. I expressed the opinion that the US Mint would have problems handing demand for the new coin. Several months later, the US Mint has had problems with virtually every aspect of the product, from the inability to obtain gold blanks to the botched production of paperback books.

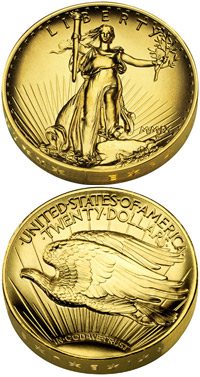
The Ultra High Relief Double Eagle recreates the original design for the 1907 Gold Double Eagle created by Augustus Saint Gaudens. Each coin contains one ounce of 24 karat gold and is struck on a specialized blank, which is 50% thicker than the blanks used for most one ounce gold bullion coins.

The US Mint began publicly touting the coin as early as March 2008, calling it a “recreated masterpiece” and the “nation’s most beautiful coin.” US Mint Director Edmund Moy has called it “one of the best coins ever made in the world throughout all of history” and likened owning the coin to owning a Monet.

Perhaps the current environment of limited gold blank supply was not the best time for the high profile launch of a flashy gold prestige coin.

Pricing and Availability

Sales of the Ultra High Relief Gold Coins began on January 22, 2009. The US Mint tried to head off the anticipated high demand by setting an ordering limit of only one coin per household. This ordering limit remains in place. Coins were initially priced at $1,189 per coin. This price has been raised three times in the subsequent months to its current level of $1,339 per coin. When sales began, the US Mint indicated that orders for the coin might take six to nine months to complete.

Many people attempted to get around the order limitation by enlisting the help of friends and family with unique household addresses. Coin dealers were also forced to try to find a way to circumvent the ordering limit. They offered a gauranteed premium to anyone willing to order the coins for them. Some customers felt that the price was set too high, but complaints were not widespread. Many were dismayed about the prospect of waiting six to nine months for their orders.

Limited Gold Blank Supply

Several days after the coins went on sale, Edmund Moy revealed that so far the US Mint had only able to obtain enough blanks to produce 29,000 coins. Customers had ordered approximately this number of coins during the first day of sales. To date more than 48,000 coins have been ordered.

The implication is that anyone who had ordered on the first day might receive their coins soon, but customers who placed their orders after the first day, might be in for a long wait. There has been no indication of whether the US Mint has been able to procure additional blanks beyond the first reported batch of 29,000.

Shipping Delays and Miscommunications

During the weeks that followed, US Mint customers began receiving a series of emails which provided a confusing array of estimated shipping dates. Some customers received four or five emails which included a different shipping date each time. These shipping dates often conflicted with the estimated shipping dates available in customer account screens. Some of the earlier dates came and went with no coins shipped.

Amidst the wave of emails, the first coin actually received in hand was reported February 9, 2009 at online social networking site Coin Network. After this first report, many assumed widespread shipping of the first 29,000 coins would follow. As the days passed, it became apparent that only a small number of coins had actually shipped. The rest were inexplicably delayed.

Shipping Problems and Website Security Issues

Following the arrival of the first coin, US Mint customers began to report shipping issues for other US Mint orders, as well as security issues that were impacting Ultra High Relief Double Eagle coin orders. The US Mint’s shipping contractor had reportedly been leaving packages filled with thousands of dollars of gold coins on customer doorsteps without signature or any other confirmation of delivery. The US Mint’s website had an easily exploited security flaw which caused some customers to have their orders canceled without authorization.

The US Mint disabled some of the functions of their website to prevent the further unauthorized cancellation of orders. They never broadly informed customers of the underlying problems or the potential resulting delays.

Production Problems for the Companion Book

The final and most recent problem in the Ultra High Relief saga relates to the Companion Book, which the US Mint produced to accompany the gold coin. Apparently, a production problem caused the book covers to warp or curl.

Today, the US Mint sent an email to all customers announcing that they would resume shipping of the Ultra High Relief coins, and the companion books would be shipped separately. The email did not mention the shipping problems, website security problems, possible gold blank limitations, and overlooked the fact that customers had never been informed of a shipping delay in the first place. Besides the series auto generated emails with inaccurate shipping dates, this was the first email sent to customers to explain why they haven’t received their coins.

[phpbay]2009 ultra high relief, 3, 11116, “”[/phpbay]

Examining the Gold ETFs, Gold Reaches New Highs

With gold continuing its run, there’s been plenty of gold appearances in the mainstream press. But the more interesting discussions usually happen elsewhere. Here’s a few noteworthy blog posts and articles related to gold.

One thousand tonnes in the trust!

The SPDR Gold Shares ETF continued its rapid inventory growth and surpassed one thousand tonnes this week. An astounding 229 tonnes have been added so far during 2009.

Where do all the gold etfs get their bullion from?

While many mainstream news reports were quick to highlight the one thousand tonne level, others started raising questions. In an atmosphere of gold scarcity, where are the Gold ETFs getting the gold for their massive daily additions?

Ten Reasons to Avoid the Gold ETF

Elaborating on the above, an article that will make you seriously reconsider any investments in Gold ETFs.

Gold Around the Globe: Setting Records

While gold in US Dollars is still laboring below its all time high reached last March, gold in other major currencies has been setting new all time highs.

Gold, Silver, and Platinum Year To Date Performance

Gold, silver, and platinum have all been strong performance so far this year, but which has done the best? The table below presents the price of gold, silver, and platinum at the start of the year, today’s price, and the change. The performance of the S&P 500 is thrown in for good measure.

31 Dec 2008 17 Feb 2009 Change
Gold 869.75 968.00 98.25 11.30%
Silver 10.79 13.90 3.11 28.82%
Platinum 898.00 1,083.00 185.00 20.60%
S&P 500 903.25 789.17 (114.08) -12.63%

Silver has been the best performer so far this year with a gain of 29%, followed by platinum with a gain of 20.6%, and gold with a gain of 11.30%. The S&P 500 is down over 12%.

Silver and platinum were both down significantly in 2008 (see 2008 precious metals performance) so they are making up for some of their lost ground. Gold is continuing its moderate but steady price appreciation. Gold has had a positive return every year for the past eight years, even amidst the wild fluctuations in virtually every other asset class.

The line up above looked somewhat familiar, so I also decided to pull price data for the exact same time period, but one year earlier. Here is the result:

31 Dec 2007 17 Feb 2008 Change
Gold 833.75 912.50 78.75 9.45%
Silver 14.76 17.38 2.62 17.75%
Platinum 1,530.00 2,060.00 530.00 34.64%
S&P 500 1,468.36 1,349.99 (118.37) -8.06%

As you can see, last year started off eerily similar. Stocks were weak and precious metals were strong, led by platinum and silver. Gold, silver, and platinum would all rise to their peak prices in early March. After that prices started to deteriorate, and then deteriorate at an accelerated pace as the wheels fell off the stock market.

Will this be a break out year for previous metals, or a re-run of last year?

Gold and Silver Market Manipulation, Paper Market Crash, Platinum Jumps

Beneath Cash4Gold’s shiny veneer, a dull reality

The Cash4Gold Superbowl ad certainly brought the company a lot of mainstream attention. However, it also brought to light many questions about their payment levels and practices.

Gold ETF inventory increasing at record pace

An interesting observation from the author. When the pace of increases spikes, the price of gold usually follows.

Vindication

OK, someone has to say it: Why is the fact that a few banks hold massive concentrated short positions in gold and silver undeniable “proof” of manipulation? Couldn’t it be possible that the banks are simply making a big, dumb bet that will lose them massive amounts of money in the future? It certainly would not be the first time…

Paper gold market will crash at Comex

From the article: “I believe that the comex will default and the entire paper gold market will crash and gold could rise very quickly to 2000 until 3000 US Dollars. When this happens it will be too late to exercise or to try purchasing physical gold.”

Russia Sberbank gold sales jump during crisis

Looking at gold investment demand in Russia. Quote from the article: “We have clients who bought 200-300 kilograms of gold.”

Platinum Jumps to Highest Since October on Investment Demand

The industrial metal jumps on investment demand.

January 2009 US Mint Gold, Silver, and Platinum Bullion Sales

Many track the tonnes in the trust for Gold and Silver ETFs in order to gauge the continuing growth in investment demand for precious metals. This year, I wanted to try my own version of tracking precious metals investment demand by reporting monthly sales totals for the US Mint’s bullion coin programs. Hopefully this will provide another aspect of information for investors to ponder.

Under normal circumstances, this information would be an excellent indicator for physical precious metals demand. However, we are not currently in an environment of normal circumstances.

The US Mint continues to ration sales of one ounce Gold Eagle and Silver Eagle coins. Additionally, they still have not yet begun offering Platinum Eagle or fractional Gold Eagle coins. This implies that there is an undefined amount of unmet physical demand which exists above and beyond the numbers. Nonetheless, I will get into the habit of posting this information.

January 2009 US Mint Bullion Sales
1 oz. 1/2 oz. 1/4 oz. 1/10 oz. Total oz.
Gold Eagle 92,000 92,000
Gold Buffalo
Silver Eagle 1,900,000 1,900,000
Platinum Eagle

Total ounces of gold sold during January 2009 was 92,000 ounces. This compares to 26,000 in January 2008. The amount does represent a decline from the prior month of December 2008 when 176,000 ounces were sold. However, as mentioned above, this may be a reuslt of ratoining and not necessarily decreased demand.

Total ounces of silver sold duing Janaury 2009 was 1,900,000 ounces. This is down from both the year ago period January 2008 when 2,170,000 ounces were sold and the prior month when 2,158,500 ounces were sold. Again, this might not necessarily be a result of decreased demand.

No platinum was sold during January 2009, as the US Mint has not resumed productoin after a suspension instated late last year.

Analysts Pile on the Gold Bull

Gold’s recent move above $900 has analysts scrambling to increase their price targets.
The last time I looked at gold price targets from analysts was in early December, when a similar flurry of activity took place. Morgan Stanley got the ball rolling by saying that gold could reach $1,000 in three years, Merrill Lynch followed with a price of $1,500 at an unspecified date, and Citigroup topped them all by mentioning $2,000.

This time around started in the same way with Morgan Stanley making a timid call for $1,075 gold in three years. From their report: “A globally synchronous and aggressive fiscal and monetary stimulus may be needed to re-inflate the global economy, and we think this continues to present significant upside to gold prices.” For their rhetoric, their target price is ridiculous, unless you consider “significant upside” to be a 6% annual gain for three years.

Merrill Lynch chimed in next with their Chief Investment Officer reiterating their prediction of $1,500 gold, but this time with a time frame of 12 to 15 months. Quote from the CIO: “With confidence in currencies shaken to the core, the yellow metal is increasingly assuming the role of “the most trusted currency. We have never seen such a rush to buy gold. It’s bringing in security and it’s still affordable.”

A few days following, both UBS and Goldman Sachs updated their previously underwater gold price targets. UBS raised their 2009 price target from $700 to $1,000. Goldman Sachs raised its forecast of $700 to $1,000 within a three month time frame.

As expressed before, I do not think we have reached the point where these periodic analyst pile ons can be used as a contrary indicator for gold. Analysts are still showing restraint, and for the most part raising their targets simply to keep up with the rising price of gold.

Silver Investment Demand

In a previous post, I reviewed the amount of silver bullion sold by the United States Mint during 2008. With this post, I will take a longer term look at silver demand, which highlights the absolute explosion in demand which has occurred in recent years.

The supporting data for the charts included with this post comes from a new section of Gold and Silver Blog which collects the US Mint Silver Bullion Sales data since the inception of the program in 1986. You can visit the page to find the monthly sales figures for any date from 1986 to present. The section also calculates the approximate silver bullion value of each period’s sales based on the average monthly price of silver.

Silver Bullion Sales in Ounces

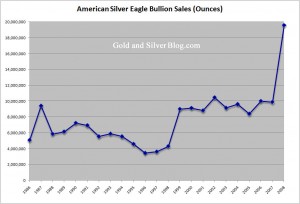
Here’s a chart summarizing the total ounces of silver bullion sold by the US Mint each year since 1986. (Click on the chart for a larger version.)

During 2008, the US Mint sold 19,583,500 ounces of silver through its bullion program. As explored previously, this marks an all time high for the program. It represents an increase of more than 98% from the prior year, and an increase of 92% from the previous all time high reached in 2002.

One important thing to note when considering the magnitude of the increase for 2008 is that the number of ounces sold could have been much greater. The US Mint suspended silver bullion sales during February before resuming sales on a rationed basis. When the rationing first began, one dealer claimed that he could have sold 500,000 ounces of silver per week, but was only allocated 100,000 ounces.

2008 Silver Bullion Sales in Dollars

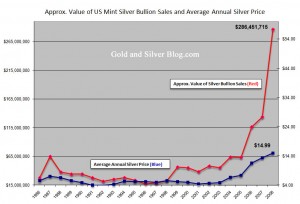
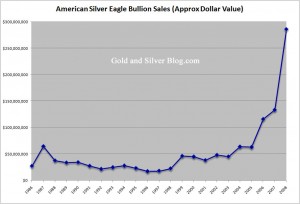
Here’s a second chart which illustrates the explosion in demand for silver in even more dramatic fashion. The chart shows the approximate dollar value of silver bullion sold by the US Mint each year. As mentioned, this was calculated based on monthly silver bullion sales and the average monthly price of silver. (Click on the chart for a larger version.)

Silver Bullion Sales Value Chart

During 2008, The US Mint recorded silver bullion sales of approximately $286,451,715. This marks an all time high and an increase of 114% from the prior year, which was also the prior all time high.

The magnitude of the increase is more pronounced when compared to silver bullion sales from earlier years of the program. Throughout the majority of the 1990’s, the US Mint was selling less than $30 million worth of silver each year. The year for the lowest value of silver bullion sold was 1996 with $17,434,050. During 2008, the US Mint recorded monthly sales exceeding this level for ten out of twelve months.

Silver Bullion Sales and the Price of Silver

But what about the price of silver amidst this explosion in demand?

Here’s a third chart which plots the value of US Mint silver bullion sales from the last chart, together with the average annual price of silver for each year. (Click on the chart for a larger version.)

Silver bullion sales increased from a low of $17,434,050 to last year’s high of $286,451,715 representing an increase of 1,543%. The average annual price of silver increased from a low of $3.95 per ounce to last year’s high of $14.99 representing an increase of 203%. While this is a respectable gain, it pales in comparison to the increase in demand.

Everyone has been waiting for the disconnect between the demand for silver and the price of silver to resolve itself. Will it finally happen in 2009?
[phpbay]2009 silver eagle, 3, 39488, “”[/phpbay]