April 20, 2024

What’s the Difference Between Gold Cast Bars, Gold Minted Bars and Gold Bullion Coins?

2014-Australian-Kangaroo-1kg-Gold-Bullion-Coin-Obverse-S
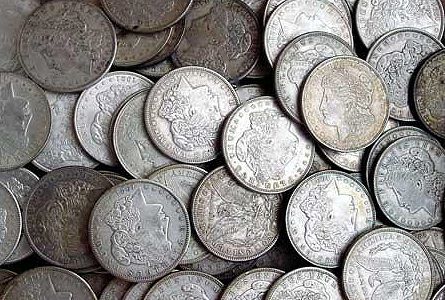
Besides offering an incredible selection of gold and silver precious metal products at fair prices, the Perth Mint excels at educating its customers.

The Perth Mint has specialized in the production of precious metal coins since 1899.  The Perth Mint operates and owns the only gold refinery in Australia and is owned by the Gold Corporation which operates under the statutory authority of the Government of Western Australia.

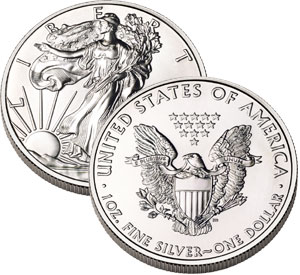
All gold and silver bullion coins and bars produced by the Perth Mint are available in 99.99% pure gold and are issued as legal tender in Australia.

In this week’s Bullion News, the Perth Mint explains to potential buyers the different factors to take into account when deciding whether to buy gold cast bars, gold minted bars, or gold bullion coins.

Cast Bars, Minted Bars and Bullion Coins

Gold Cast Bars

Investors seeking to pay the lowest premium over spot gold prices will typically consider purchasing gold cast bars since they have the lowest fabrication cost.  The Perth Mint warns buyers that when buying gold cast bars it is essential to make purchases from a totally trustworthy seller to ensure weight, purity and re-saleability.

The Perth Mint sells gold cast bars in 1 ounce, 2 1/2 ounce, 5 ounce, 10 ounce, 20 ounce, and 50 ounce weights.  The current markup over spot on a 1 ounce cast bar is only $35.  Investors planning to make larger purchases such as a 20 oz cast bar can pick it up for less than $100 over the current spot price of $25,633.

Gold Minted Bars

Gold minted bars are cut from rolled gold, have a better finish and appearance, and are stamped with various designs on a minting press.  I have observed while traveling that gold minted bars are extremely popular in gold and jewelry stores in China since they can be purchased in sizes as small as 0.3 grams and often come in a tamper proof security container.

The Perth Mint sells gold minted bars in 5 g, 10 g, 20 g, 1 oz, 50 g, 100 g, and 10 oz.  A one ounce gold minted bar currently sells for a premium over spot of around $44.
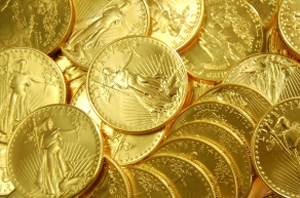
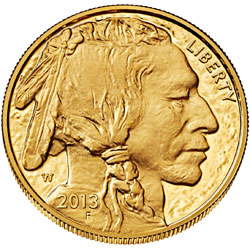
Gold Bullion Coins

Gold bullion coins are typically favored by many small investors since they are issued and guaranteed by governments, come in numerous sizes, are difficult to counterfeit due to their thin size, and are issued with distinctive and detailed designs which add another dimension to the desirability of owning gold.  The minting process to produce a gold bullion coin is far more complex than that for producing bars and therefore the premium over the gold spot price is significantly higher.

The Perth Mint sells gold bullion coins ranging in size from only 1/20 ounce to a massive 1 kilogram.  The one kilogram gold bullion coin currently sells for about $42,000.

A Must Buy Silver Miner That Is Adding New Reserves at Just $0.38 Per Ounce

PAAS silverSilver and gold mining stocks have been indiscriminately sold off during the correction in precious metal prices.  While the sell off has been painful for investors in precious metal mining stocks it also presents profitable opportunities.  The price of gold and silver will not remain at bargain levels forever and now is the time to establish positions in selected mining stocks that offer solid long term capital appreciation.

Investing in precious metal mining stocks has recently been a minefield for investors due to a variety of reasons including poor management decisions, overpriced acquisitions, increased production costs, increased government taxation, and falling gold and silver prices.

One silver mining stock that has rock solid finances, pays a dividend, owns substantial silver reserves, and has excellent price appreciation potential when silver prices go back up is Pan American Silver Corp (PAAS).

Although no one can predict when silver prices will head back up, both PAAS and silver appear to be forming bottoms.  Pan American Silver recently made a multi-year double bottom in the $10 per share range and silver stubbornly refuses to break below the $18 per ounce level despite wide ranging bearish commentary on the metal.

paas

Courtesy: Yahoo Finance

Courtesy: Kitco.com

Courtesy: Kitco.com

Moving beyond technical analysis there are also many fundamental factors in place that could easily send the price of PAAS to much higher levels.  Here’s my list of the top 7 reasons why now is a good time to buy the common stock of Pan American Silver.

  1. According to the company website, over the past ten years PAAS has added almost 270 million ounces of new silver reserves at a cost of just $0.38 per ounce.  The new silver reserves more than replaced the 225 million ounces of silver mined since 2004.
  2. During the first quarter of 2014 PAAS increased its silver production by 5% to 6.61 million ounces.
  3. In order to maintain a strong financial position in the face of declining silver prices PAAS implemented cost cutting measures while improving operational efficiency.  The all-in sustaining cost per silver ounce sold dropped by 20% in the first quarter of 2014 to $15.54 per ounce while cash costs dropped to $8.25 per ounce from $11.33 in the comparable prior period.
  4. Pan American Silver was just upgraded by Charles Schwab from “avoid” to “neutral” and added to the firm’s trigger stock list which identifies PAAS as a buy candidate if the price closes above $13.81.  The reasons listed by Schwab for upgrading the stock include a rising 50 and 200 day moving average which is bullish, an up/down pattern that indicates the stock is under accumulation, and a bullish trend as indicated by the moving average convergence/divergence (MACD).
  5. PAAS is in a strong financial position with ample liquidity.  As of March 31, 2014, the company held cash and short term investments of $394 million and working capital was over $680 million.
  6. The Company pays a current quarterly dividend $0.125 per share or $.50 annually which works out to an annual yield of almost 4% which is about 4% higher than what a saver can currently get from a bank due to the Federal Reserve’s zero interest rate policies.
  7. PAAS sells below its book value of $14.33, has only $40 million in long term debt, and generates operating cash flow of over $123 million.  The Company does not engage in price production hedging so any increases in the price of silver flow right to the bottom line.

A strong financial position, long life low cost silver reserves, a 4% annual dividend, and a currently depressed price of silver all form the perfect recipe that should make the purchase of PAAS common stock a rewarding experience.

Gold Advance Stymied by Investor Worries and High Gold Silver Ratio

feature-300x200The price of gold has held its own this year despite a long list of reasons from bearish analysts for not owning gold.  From a closing price of $1,225 at the start of the year gold has managed to eke out a small gain of 1.8% to a price of $1,247.50 at Friday’s close.  In mid March gold had reached a high of $1,385 but quickly surrendered those gains.

In a recent interview with Bloomberg several analysts listed various reasons for the unease in the gold market including:

  • selling by hedge funds
  • a lack of upward price momentum which is discouraging investors from making new purchases
  • anxiety over future gold and silver pricing as major banks drop out of the market for establishing the daily gold and silver fix price
  • the risk of a large drop in the price of gold if it breaks technical support at $1,230
  • an increase in the gold silver ratio to almost 70 from the more normal long term average of around 55 to 60.
Courtesy: stockcharts.com

Courtesy: stockcharts.com

One analyst interviewed by Bloomberg expects the gold silver ratio to converge via a drop in the price of gold, which is one possibility.  Another way in which the gold silver ratio could drop, of course, is if silver outperforms gold.  Since mid 2012 gold has outperformed silver by a relative percentage of about 17%.

gld vs slv

On an absolute basis silver has experienced a major price decline from almost $50 per ounce in March 2011 to $19.94, a price last seen in early September 2010.

slv

Is it time to buy or sell gold and silver?  Based on information from precious metal analysts, which is probably already fully discounted by the markets, the risks of buying gold and silver today are very high.  Kinda reminds me of what stock analysts were saying about buying stocks in early 2009.

American Eagle Silver Bullion Coin Demand Remains Strong – 2014 Should Shatter Previous Sales Record

proof-silver-eagleThe American Eagle silver bullion coins produced by the US Mint remain extremely popular with retail investors.  During 2013 silver bullion coin sales hit a record high of almost 43 million ounces and would have been even higher if the US Mint had been able to keep up with demand.  The US Mint actually ran out of silver bullion coins late in the year and suspended sales for most of December and part of January 2014.

Sales of silver bullion coins exploded in the wake of the financial crisis during 2008 when investors began to seriously question of value of paper money which could be manufacturing at will and in unlimited quantity by a profligate government.

Prior to the financial crisis yearly sales of the silver bullion coin ran between eight and ten million ounces.  Since 2010 yearly sales exploded to over 30 million ounces per year and during 2013 exceeded 40 million ounces.

According to the US Mint May sales of the silver bullion coin totaled 3,988,500 ounces up by almost 12% from the previous month and up by 15% from the comparable prior year month.

Sales of the silver bullion coins are shown below by year with 2014 sales through May 31st.

The American Eagle silver bullion coins cannot be purchased by individuals directly from the U.S Mint.  The coins are sold only to the Mint’s network of authorized purchasers who buy the coins in bulk based on the market value of silver and a markup by the U.S. Mint.  The authorized purchasers sell the silver coins to coin dealers, other bullion dealers and the public.  The Mint’s rationale for using authorized purchasers is that this method makes the coins widely available to the public with reasonable transaction costs.

If the US Mint is able to keep up with demand, 2014 should be another record breaking year for sales of the American Eagle silver bullion coins.  If the pace of silver coin sales continues at the current rate sales for 2014 could easily top 50 million ounces, an increase of about 16% from last year.

Gold Bullion Coin Sales Steady In May But Plunge From Previous Year

2014-proof-gold-eagleThe sale of gold bullion coins by the US Mint remained steady in May compared to the previous month but declined sharply from year ago levels.  There are numerous theories on why gold demand and prices have not recovered in 2014.

The world seems to have regained confidence in paper money despite the fact that the financial system is now more leveraged than before the financial crisis and the debt problems which caused the financial crisis have simply been papered over with more debt.  Meanwhile, investors in both the stock and bond markets perceive risk to be low and the bulls outnumber the bears by a margin reminiscence of the pre-crash year of 2007.

The only asset class with a preponderance of bears seems to be precious metals.  When the crowd is leaning in one direction, it’s a perfect setup for an eventual price reversal suggesting that long term precious metal investors currently enjoy the opportunity to be greedy when others are fearful.

Despite the constant bearish rants, gold has been relatively stable during 2014.  After starting the year at $1,225 per ounce gold reached a high of $1,385 on March 14 and is currently at $1,244.50 for a gain of 1.6% on the year.

Gold Bullion U.S. Mint Sales Since 2000 as of May 31, 2014
         Year                            Ounces Sold
2000 164,500
2001 325,000
2002 315,000
2003 484,500
2004 536,000
2005 449,000
2006 261,000
2007 198,500
2008 860,500
2009 1,435,000
2010 1,220,500
2011 1,000,000
2012 753,000
2013 856,500
2014 217,500
TOTAL                                                9,076,500

During May the US Mint reported sales of 35,500 ounces of the American Eagle gold bullion coins, down from 38,500 ounces in the previous month.   Gold bullion coin sales plunged from last May when the Mint sold a total of 70,000 ounces.

Since monthly gold bullion coin sales can vary dramatically a look at the average monthly and year to date sales can give a more enlightened view on demand.  As of May 31, 2014 a year to date total of 217,500 ounces of gold bullion coins were sold by the Mint compared to 572,000 ounces in the comparable year ago period, a decline of 61.8%.  Average monthly sales of gold bullion coins during 2014 through May 31 were 43,500 ounces compared to 114,000 ounces last year.

Based on year to date sales, annualized sales of gold bullion coins for 2014 are projected at 522,000 ounces or a decline of 39.1% from the 856,500 ounces sold during 2013.

Strong Gold Demand and Dwindling Gold Deposits Make Gold a Compelling Investment

gold-bullionRobust gold demand and dwindling ore deposits represent an imbalance between supply and demand that almost guarantees higher long term gold prices.  As discussed in Peak Gold, almost all of the earth’s supply of gold reserves have already been mined.

At the end of 2012 it is estimated that all the gold ever mined in history totaled approximately 173,000 metric tonnes.  According to the Perth Mint, a study done by Natural Resource Holdings estimates that there are only about 56,674 metric tonnes of recoverable gold reserves left.  If this bleak assessment is correct, over 75% of the world’s total gold reserves have already been mined.

Further confirmation of the basic imbalance between supply and demand for gold can be seen in today’s release by the World Gold Council of gold demand trends for the first quarter of 2014.

  • Global jewellery demand rose 3% in the first quarter to 571 tonnes
  • Total investment demand fell slightly to 282 tonnes from 288 tonnes last year
  • The outflows from gold ETFs slowed dramatically to 0.2 tonnes compared to 177 tonnes in the first quarter of last year
  • Gold purchases by central banks was 122 tonnes in the first quarter, the 13th consecutive quarterly that central banks were net purchasers
  • Mine production increased by 6%

Although mine production increased slightly in the first quarter, new gold discoveries have plunged and the quality of ore reserves being mined is declining.  The Wall Street Journal reports that One argument for Big Gold: There ain’t much gold left.

The depletion of global gold mines, and the resulting increase in extraction costs, is one of the main forces pushing gold miners to combine as they look for efficiencies or to gain access to rivals’ high-grade deposits.

“There is every reason to do that deal, and the reasons not to do it weren’t geology, but man-made,” said Douglas B. Groh, a fund manager at Tocqueville Asset Management LP, which owns Newmont stock. “The nature of geology is such that gold does not occur in large volumes, but the capital exploiting it is robust.”

The gold industry ramped up exploration as prices increased by a factor of six from 2001 through 2012 to $1,750 a troy ounce. Prices since have tapered off to around $1,300 an ounce.

Discoveries also have tapered off. In 1995, 22 gold deposits with at least two million ounces of gold each were discovered, according to SNL Metals Economics Group. In 2010 there were six such discoveries, and in 2011 there was one. In 2012: nothing.

Even in Nevada, which mines around three-quarters of all U.S. gold, production has dropped a third since peaking in 1998. Around 40% of Newmont’s and Barrick’s production comes out of Nevada, with that possible economy of scale a big factor in their proposed merger.

“Deposits are simply harder to discover,” said John Muntean, an associate professor of mines and geology at the University of Nevada.

There also is simply less gold to unearth. All the gold ever mined could fit in a 60-foot cube. At around 0.005 parts per million, gold’s presence in the Earth’s crust is minute compared with that copper, at over 50 parts, or iron, at more than 50,000.

Miners are plowing through available gold reserves faster than they are other metals. Global gold production was equal to 5.1% of the 54,000 tons in available reserves last year, according to the U.S. Geological Survey, theoretically meaning it would take 19.5 years to exhaust supply. That compares with 38.5 years for copper and 28 years for iron ore.

On a long term basis, the supply and demand situation in the gold market strongly suggests much higher prices in the future.

Silver Remains in a Tug of War Between Supply and Demand

proof-silver-eagleAfter a fierce correction from the highs of 2011 have  the market forces of supply and demand resulted in a stabilized silver price?

On the demand side the industrial use of silver is at a nine year high with fabrication usage expected to rise to over 890 million ounces.   A wide variety of businesses use huge amounts of silver in the production of such items as jewelry, solar panels, electronics, cars, tableware, and photography.

Although silver is most commonly associated by many people as a precious metal investment the industrial demand for silver far exceeds investment demand.  For example, sales by the U.S. Mint of the ever popular American Eagle silver bullion coins hit a record last year of almost 42 million ounces (see Silver Bullion Coin Sales Soar) but this amount is a fraction of industrial usage. Since 2000 to date the U.S. Mint has sold over 292 million one ounce American Eagle silver bullion coins which amounts to only 32% of  estimated industrial demand for just one year.

Even as industrial demand for silver booms, Bloomberg News reports that investment demand for silver has diminished due to tapering of quantitative easing by the Federal Reserve, reduction of the safe haven appeal of silver, reduced demand by China, and the correlation coefficient between gold and silver.

Silver is being undermined by its association with gold.

gold-bullion

While makers of everything from jewelry to solar panels are buying the most silver in nine years, prices are languishing. Investors are dismissing industrial demand and instead focusing on the waning appeal of precious metals as a haven, with the Federal Reserve paring economic stimulus measures, inflation muted and equities rallying.

Silver has been dragged down by a yearlong slump in gold, the commodity most widely held by investors in exchange-traded funds, following a decade-long rally that saw prices for both surge more than sixfold. The five most-accurate precious-metals analysts tracked by Bloomberg over the past two years predict silver will average $18.80 an ounce in the third quarter, the lowest since 2010, and gold will drop 7.3 percent.

“The industrial driver can help, but I don’t think it’s as influential as the investor,” said Robin Bhar, head of metals research at Societe Generale SA in London and the most-accurate forecaster tracked by Bloomberg. “Investors were bullish silver because gold was in a bull market. Now that we have gold in a bear market, there’s less enthusiasm coming from investors.”

The correlation has been strong. From December 2008 to June 2011, silver tripled and gold surged 70 percent, with both touching all-time highs, as the Fed pumped more than $2 trillion into the financial system and cut interest rates to a record in a bid to boost the economy. Last year, when signs of economic growth sent gold down 28 percent, silver plunged 36 percent. The declines were the most for both metals since 1981.

Goldman said in an April 13 report that in the long term, silver tends to track gold, and its forecast reflects the historical ratio to gold. An ounce of gold bought 67.21 ounces of silver in London on April 30, the highest since July. The average over the past 30 years is 64.8.

The link with gold is stronger than that with industrial metals. The mean of silver’s 30-week correlation coefficient to gold was 0.86 over the past five years, compared with 0.51 with the London Metal Exchange Index of industrial metals, data compiled by Bloomberg show. A figure of 1 means two assets always move in the same direction.

“The precious-metal characteristic is likely to dominate,” said Barnabas Gan, an analyst at Oversea-Chinese Banking Corp. in Singapore, and the second-most accurate precious metals forecaster over the past two years. “The risk of higher real interest rates may likely magnify in the middle-long run, and thus raises the opportunity cost for holding silver. The improving global economic picture is also likely to pale safe-haven demand.”

Concern over the value of haven assets is trumping signs that industrial demand is improving. Half of silver supply is used to make things, more than the 10 percent for gold, and demand is picking up as economic growth fuels sales of electronics and cars from China to the U.S.

Since precious metals generally earn returns only through price gains, silver investors were “disillusioned” by the slump over the past year and put their money elsewhere, New York-based researcher CPM said in an April 29 report. Investment demand tumbled 42 percent last year to 105.3 million ounces, the lowest since 2008, according to CPM, which forecast average prices in 2014 will be lower for a third straight year.

SILVER DOLLARS

At the same time, fabrication usage including by makers of cars, jewelry and tableware will rise 2.9 percent this year to 890.7 million ounces, the most since 2005, CPM said. Silver content is increasing in vehicles with more electronics, according to Metals Focus Ltd., a London-based research company. After dropping last year, demand from electronics and battery makers will rebound in 2014, CPM forecasts.

Most industrial metals will get a boost from growth. The world economy expanded 2.1 percent in 2013 and will increase 2.8 percent this year and 3.1 percent in 2015, according to economists surveyed by Bloomberg. While that will help spur a 2.1 percent gain in industrial and photographic demand for silver, investors will sell 250 metric tons from funds backed by the metal, Barclays Plc estimates.

“Silver is not benefiting even though it has so much industrial use as people still call it a precious metal,” James Paulsen, the Minneapolis-based chief investment strategist at Wells Capital Management, which oversees about $357 billion in assets, said. “Its a tug of war between its safe-haven appeal and its use as industrial metal.”

Hedge funds have cut their bets on higher silver prices by 90 percent in the past two months on the Comex in New York, holding a net-long position of 2,620 futures and options in the week to April 22, U.S. Commodity Futures Trading Commission data show. The five-year average is about 20,510 contracts.

Despite a huge appetite for silver by industrial users, the reduction of investment demand and a production oversupply may continue to pressure silver prices. During 2014 HSBC is projecting an increase in silver supply to 1.09 billion ounces with demand remaining flat at 938 million ounces.

Until the financial system blows up again, the tug of war between supply and demand in the silver market is likely to restrain silver prices for the immediate future.

Sales of Platinum American Eagle Coins Slow Down After Fast Start

2013 Platinum ProofUS Mint Resumes Production of American Eagle Platinum Bullion Coin

The United States Mint first began minting the American Eagle platinum bullion coin in 1997 but suspended production in late 2008 when demand for gold and silver bullion coins skyrocketed in the wake of the financial crisis.  With its production capacity strained by huge investor demand for gold and silver coins, the US Mint decided to suspend the production of platinum coins.

In 2007, the year before suspending production, annual sales of the platinum bullion coin totaled only 9,050 ounces.  During 2008, the platinum bullion coin was sold up until November and a total of 33,700 ounces of coins were sold.  The coin had been available in one ounce, one-half ounce, one-quarter ounce, and one-tenth ounce sizes with legal tender values of $100, $50, $25, and $10, respectively.

In addition to the bullion version of the American Eagle platinum coin a numismatic proof version of the coin was also available from 1997 to 2008 in all four sizes.  Despite suspending production of the bullion platinum coins in 2008 the Mint continued to annually produce one numismatic version of the platinum coin for collectors.  The numismatic proof version of the platinum coin undergoes a specialized minting process at the Mint where they are struck multiple times with special dies that result in the coin having a softly frosted finish with detailed images that seem to float above the mirror like surface of the coin.

AE Platinum Proof Reverse

AE Platinum Proof Reverse

The 2014 American Eagle Platinum bullion coins are produced by the West Point Mint and only come in a one ounce size.  In March, the first month that the coins were available, the Mint sold 10,000 coins as authorized purchasers built up inventories for sale to the public.  Just as with the American Eagle gold and silver bullion coins, the public cannot buy them directly from the Mint but must purchase them through US Mint authorized purchasers or coin dealers.  April sales of the platinum bullion coins totaled only 1,200 ounces.

Platinum is one of the rarest of precious metals with annual production through mining and recycling of only about 7 million ounces.  The vast majority of all platinum mined comes from South Africa and Russia both of which have unstable political situations which has resulted in frequently curtailed production.  Platinum consumption is expected to exceed supply during 2014 with the deficit coming out of platinum stocks.

Resumption of the production of platinum coins by the US Mint now allows investors the opportunity to diversify their precious metal holdings

Gold Bullion Coin Sales Rise, Silver Bullion Coin Sales Could Hit All Time Record High in 2014

american-silver-eagleGold and silver bullion coin sales by the U.S. Mint during April turned in mixed results with gold sales up and silver sales down.  Despite the fact that gold and silver are in the bargain basement due to price declines, investment demand remains relatively subdued due to tapering of money printing by the Federal Reserve and the apparent recovery of the U.S. economy.

Investor perceptions of precious metals as a safe haven appear diminished despite the ongoing and unprecedented monetary easing by central banks and unrestrained government borrowings.  Gold began the year selling for $1,225 per ounce.  After reaching a high of $1,385 on March 14 gold  declined to a current price of $1,281.25 leaving it up on the year by 4.6%.

The U.S. Mint reported that sales of the American Eagle gold bullion coin in April totaled 38,500 ounces up 83% from 21,000 ounces sold in the previous month but down by a substantial 81.6% from April of 2013 when the Mint sold 209,500 ounces.  After dropping for three years in a row since 2009, sales of the American Eagle gold bullion coins increased in 2013 to 856,500 ounces up by 13.7% from total sales of 753,000 ounces in 2012.

(Sales figures for gold bullion coins on the charts below are as of April 30, 2014.)


Gold Bullion U.S. Mint Sales Since 2000
         Year                            Ounces Sold
2000 164,500
2001 325,000
2002 315,000
2003 484,500
2004 536,000
2005 449,000
2006 261,000
2007 198,500
2008 860,500
2009 1,435,000
2010 1,220,500
2011 1,000,000
2012 753,000
2013 856,500
2014 182,000
TOTAL                               9,041,000

Total sales of gold bullion coins year to date total 182,000 ounces.  Based on the current sales rate through April 30th, annualized sales of gold bullion coins would come in at 546,000 ounces, the lowest amount of sales since 2007 when only 198,500 ounces were sold.

Silver Bullion Coin Sales Could Reach Another Record in 2014

Sales of the American Eagle silver bullion coins remained strong in April with a total of 4,590,500 coins sold, down slightly from the previous month’s sales of 5,354,000.

The one ounce American Eagle silver bullion coin remains extremely popular with investors.  Total coin sales during 2013 reached an all time high of 42,675,000.  The previous record sales year going back to 2000 occurred in 2011 when investors scooped up 39,868,500 coins.  If the current sales pace continues, total sales of the silver bullion coin during 2014 could reach a record breaking 55 million ounces.

Why Gold and Silver Could Outperform Every Other Asset Class in 2014

gold-buffalo
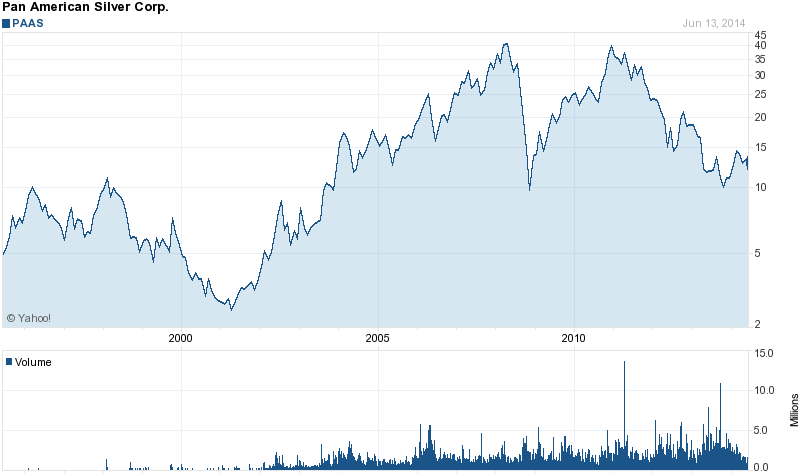
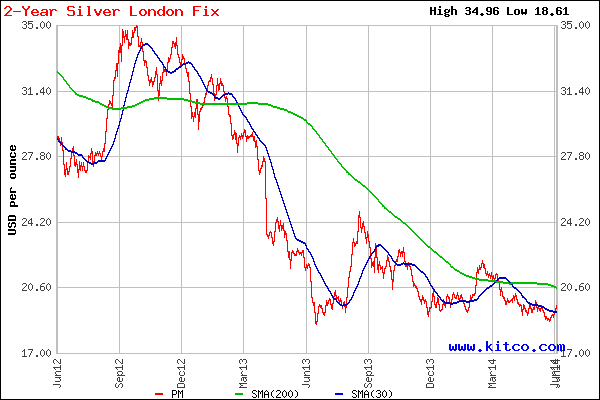
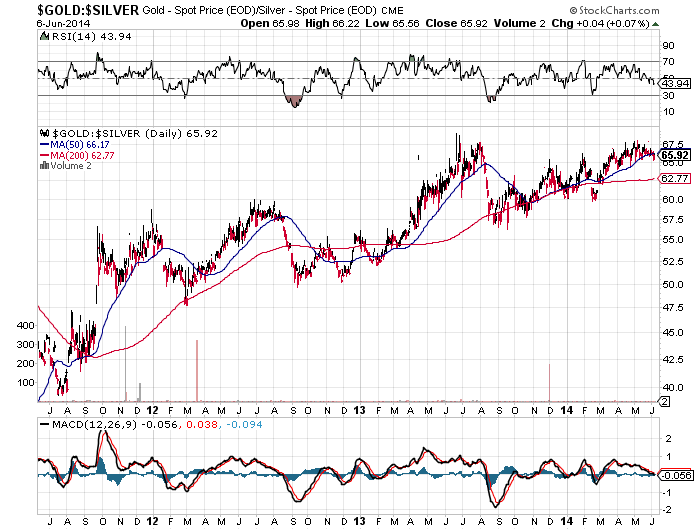
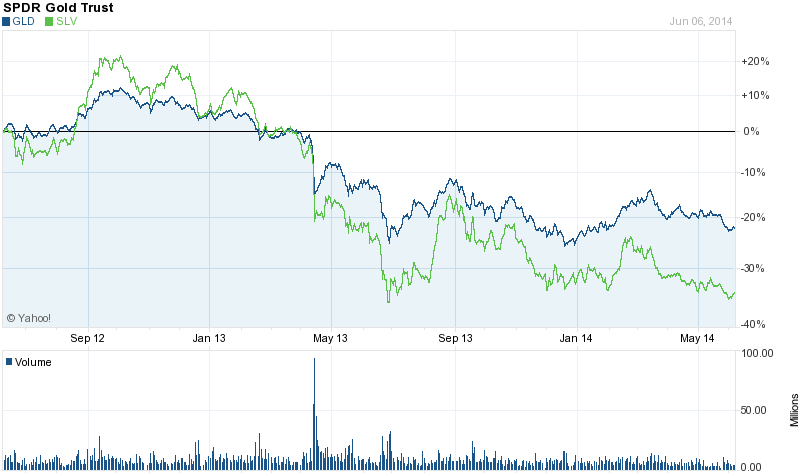
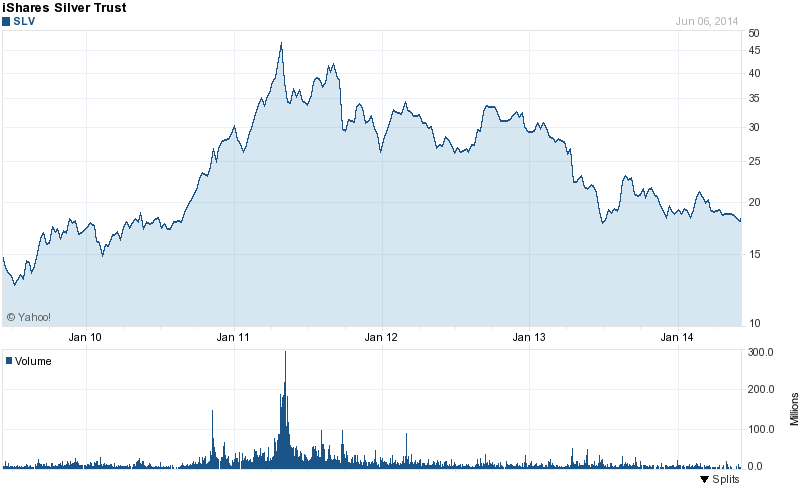
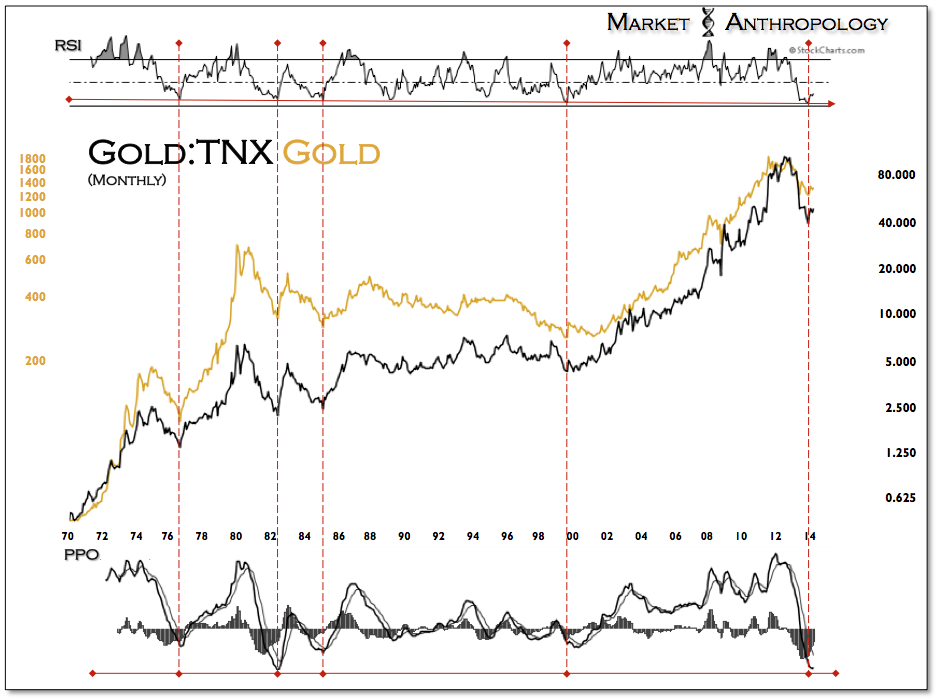
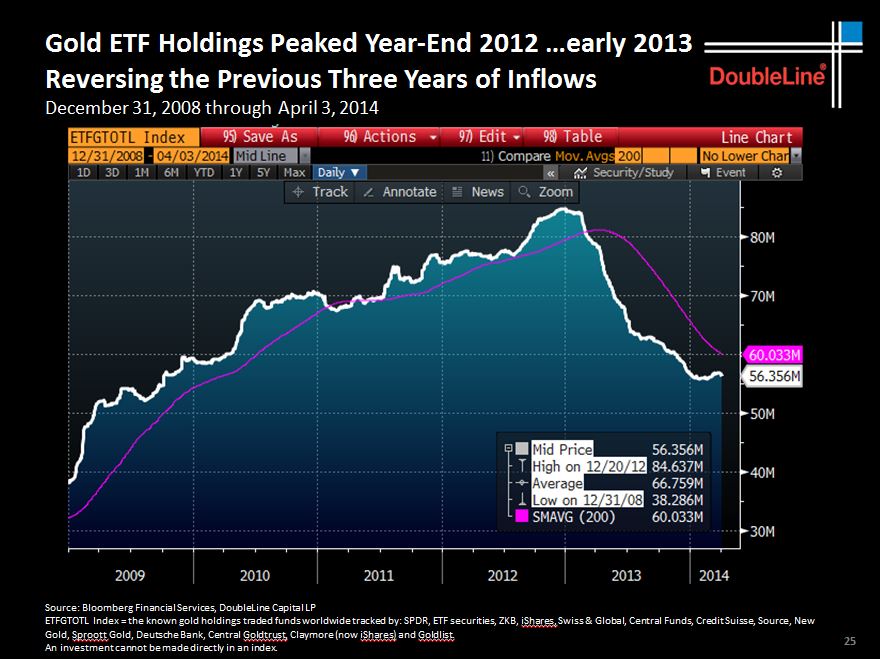
After almost a three year bear market in gold and silver it’s safe to conclude that most of precious metal bears have sold out and moved on.  As gold and silver prices corrected sharply over the past three years, the chorus of bearish sentiment in the mainstream press has become endemic, thus setting the stage for a powerful and unexpected contra rally.

What will set off an explosive rally in precious metals remains to be seen but there are plenty of potential triggers including war in the Ukraine or South Korea as well as the significant financial risk of collapsing asset bubbles engineered by the extremely loose monetary policies of the world’s central banks.

Here’s some of the most interesting recent commentaries on why 2014 could be a big year for gold and silver.

Gold and Silver Are Almost Ready to Rally

While every journey does begin with the first step, we need more evidence than a minor rally day to declare that a bull market has arrived. For the SPDR Gold Trust ETF (ticker: GLD), the April 24 rally was not very remarkable other than the fact that the day started with a loss and ended with a gain.
Now let’s talk about what it was rather than what it wasn’t.

For starters, it was an encouraging hold of short-term support from March. And the failure to set a lower low for the current two-month decline also falls on the bullish side of the ledger.

But more importantly, it was a suggestion that prices will not travel to the bottom of a giant year-long trading range again. In other words, any further strength now would tell us that investors are ready to buy. They will not wait for “better” prices to buy at the bottom of the range, and that means a shift in sentiment for the better.

Finally, the gold market has a “golden cross” in place. This is a condition where the 50-day average crosses above the 200-day average, and while it is really a stock market indicator, the macro look and feel are the same to me. After a long decline and period of sideways movement, this is the market’s first sign it has had enough healing. As long as the sideways trading range is not so long that the averages are completely flat, I think the signal is worthy of respect.

We can also we look at rising momentum indicators as bullish. Weekly charts show the relative strength index (RSI) setting higher lows between June and December even as prices set equal lows. This means the bears were tired as 2013 ended, and the fact that this indicator continued to rise this year suggests the bulls are starting to wake up.

Silver also had a bullish short-term reversal last week, but it has a lot more technical damage to repair. It does not have a moving average golden cross in place, and has already fallen rather close to its previous major lows from last year. Generally, that’s not a good sign, but in this case it’s not so clear cut.

When we look at the bigger picture using the iShares Silver Trust (SLV), we will see something really interesting. Recall 2010, when both gold and silver shot higher, but silver moved at a much faster pace than gold did. On the charts, we can see the technical launching point and breakout in August of that year.

As we see in many markets that appear to be bubbles, with such steep gains and ever-accelerating trends, the “bubble” part of the rally is often completely erased before conditions stabilize and then improve. Silver’s rally is now erased, which means the market is likely washed out and left for dead. Even so, there is a bullish RSI condition in place for the white metal, just as there is for gold.

 The Long Goodbye – by Andy Xie

The recent tumbling of Internet and biotech stocks may indicate that the speculation in such stocks has peaked. But, unlike in 2000, the bursting will occur in slow motion. The financial market structure has radically changed in the past 15 years. Too many money managers have a one-sided incentive to long such stocks.

The global financial system has experienced one bubble after another because major central banks have kept monetary policy loose. Prolonged loose monetary policy has made the financial system extraordinary large relative to the real economy. This change forces central banks to respond to negative shocks, like the bursting of a bubble, from the financial system. Such responses make the financial system even bigger. This vicious cycle explains why speculation has become such a powerful force.

A bubble cannot expand forever, even in an environment of loose monetary policy. The balance between fear and greed can tip over when the price of an asset becomes too high, like Internet stocks now relative to the average. The subsequent deflating bubble, in a continuing environment of loose money, just shifts air into other assets.

The talk of monetary tightening in the United States or China will not be followed up with strong enough actions. Real interest rates will remain negative until another crisis, like high inflation or hyperinflation or political crisis, force the hand.

Gold is the safe asset in today’s environment. As paper currencies lose credibility, the demand for gold will surge. The alternative digital currencies are fool’s good, really scams to take advantage of people’s fear over the potential collapse of paper currencies.

Two changes in the past 15 years have made bubble formation a constant feature of financial markets around the world. The inefficiencies in capital allocation and income redistribution to finance are the main reason for today’s sluggish global economy.

At the macro level, globalization has made inflation slow to emerge, as multinational companies can shift production around the world in response to cost pressure. This force has given central banks more room in increasing money supply without facing the inflation consequences for years. Hence, central banks around the world have become more active in response to economic fluctuations. The consequence is a rising ratio of money supply or credit to GDP. By definition, this means a bigger and bigger financial system, which needs more and more income to survive.

The real economy, as the previous analysis indicates, can only bear so much. Bubble formation has become central to supporting a bloated financial system. A large and bubbly financial system is unstable. Its periodic collapse brings down the economy, which triggers more monetary stimulus. Hence, constant monetary stimulus and an ever-expanding and bubbly financial system have formed a vicious cycle.

What’s Up With Gold and Silver? (Market Anthropology)

Anecdotally, we are seeing and hearing from those anxiously long the precious metals sector and contentiously short. With gold and silver down sharply in the early morning session – then reversing violently higher, the emotional spectrum in the market is likely diverged at or near another extreme. Over the past 10 months, both bulls and bears alike have been waiting for the next leg to commence. Instead, the market has played the jester – traversing a narrowing range and taking turns at frustrating both sides.

When will the argument resolve itself ?

Although it’s felt like a standing room only performance of Waiting For Godot, we expect long-term yields still hold the key to the next chapter for precious metals and the broader market story. We continue to view the move in 10-year yields as historically stretched to a relative extreme (see chart), a notion apparently lost on many participants as the Fed tapers their way to the end of QE and through an esoteric Fed cycle.
Just this week we saw that a Bloomberg survey of 67 economists unanimously expected 10-year yields to rise over the next six months (see Here). From a contrarian point-of-view, this should wake up participants that underlying sentiment is dangerously listing towards one side and the downstream and kinetic effects could be severe in many markets. The ratio chart below depicts the relationship between gold and 10-year yields, which as we noted last December had also reached a historic extreme. If and when long-term yields breakdown, we suspect a much stronger tailwind to develop behind precious metals.

As the Nikkei was breaking down at the start of the 1990’s, risk appetites changed and developed a palette for the Nasdaq. After the Nasdaq cracked going through the Millennium, investors turned to precious metals. The cycle can also come full circle, as we believe the performance and seasonal presentments of the current risk du jour describes. As the biotech index now turns down just past its zenith, we expect silver and the precious metals sector to begin making their way materially out of the trough they have trended towards over the past three years.

The Reformed Broker

Jeff Gundlach looks at the gold market. He’s not a big gold guy, but says that if you’ve held it this long (and through this much pain), “for god’s sake don’t sell it here!” He thinks the holders who remain are the quintessential, proverbial “strong hands” and that gold miner equities are completely underpriced for the potential of the metal running back up again. He’s more positive on commodities now in general, given how uninterested the investment community seems to be.

http://www.thereformedbroker.com/wp-content/uploads/2014/04/25.jpg