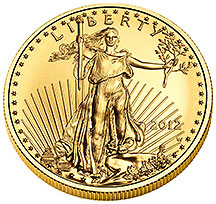
 The latest sales figures from the U.S. Mint show that sales of both gold and silver bullion coins declined dramatically during July. While sales of silver bullion coins have remained at historically high levels, sales of the gold bullion coins have been in a steep decline since 2009.
American Eagle Gold Bullion Coin Sales
Sales of the American Eagle Gold Bullion coins during July totaled 30,500 ounces, a 49.2% decline from June sales of 60,000 ounces. Two previous months of the year had lower gold coin sales than July. During February 21,000 ounces of gold bullion coins were sold and in April only 20,000 ounces were sold. The year to date average monthly sales figures for gold bullion coins total 53,428 compared to a monthly average of 83,333 during 2011.
The all time yearly sales record for the American Eagle gold bullion coins was set during 2009 when it looked as if the entire U.S. banking system was about to collapse. Sales in each subsequent year have been lower than 2009 despite the increase in the price of gold since then. In 2009 gold closed the year at $1,087.50 per ounce, subsequently hit a high of $1,895 on September 5, 2011 and closed today at $1,615.90 in New York trading. If sales during 2012 are annualized, total gold bullion coin sales will reach approximately 641,000 ounces, the lowest amount since 2007 when yearly sales came in at 198,500 ounces.
Listed below are yearly sales figures for the American Eagle gold bullion coins since 2000. Sales for 2012 are through July 31st.
| Gold Bullion U.S. Mint Sales By Year | ||
| Year | Total Sales Oz. | |
| 2000 | 164,500 | |
| 2001 | 325,000 | |
| 2002 | 315,000 | |
| 2003 | 484,500 | |
| 2004 | 536,000 | |
| 2005 | 449,000 | |
| 2006 | 261,000 | |
| 2007 | 198,500 | |
| 2008 | 860,500 | |
| 2009 | 1,435,000 | |
| 2010 | 1,220,500 | |
| 2011 | 1,000,000 | |
| 2012 | 374,000 | |
| Total | 7,623,500 | |
The graph below shows gold bullion coins sales since 2012, with sales annualized for 2012.
American Eagle Silver Bullion Coin Sales
According to the U.S. Mint, sales of the American Eagle silver bullion coins totaled 2,278,000 ounces during July, a decline of 20.3% from June’s total of 2,858,000. The highest monthly sales of the silver bullion coins during 2012 was 6,107,000 ounces recorded in January followed by the lowest monthly sales of 1,490,000 ounces in February. Average monthly sales of the silver bullion coins through July was 2,810,000.
The silver bullion coins have showed resilient demand despite the drop in silver prices since mid 2011. Based on year to date sales figures, total sales of the silver bullion coins could approach 34 million ounces, not far below the record sales figure recorded in 2011 when almost 40 million ounces were sold.
Total annual sales by the U.S. Mint of the silver bullion coins since 2000 are shown below. Sales for 2012 are year to date totals through July.
| American Silver Eagle Bullion Coins | ||
| YEAR | OUNCES SOLD | |
| 2000 | 9,133,000 | |
| 2001 | 8,827,500 | |
| 2002 | 10,475,500 | |
| 2003 | 9,153,500 | |
| 2004 | 9,617,000 | |
| 2005 | 8,405,000 | |
| 2006 | 10,021,000 | |
| 2007 | 9,887,000 | |
| 2008 | 19,583,500 | |
| 2009 | 28,766,500 | |
| 2010 | 34,662,500 | |
| 2011 | 39,868,500 | |
| Jul-12 | 19,670,000 | |
| TOTAL | 218,070,500 | |
The American Eagle gold and silver bullion coins are sold by the U.S. Mint only to Authorized Purchasers who in turn resell the coins to the general public and other dealers. Numismatic versions of the American Eagle series gold and silver coins can be purchased by the public directly from the U.S. Mint.

I’d be very surprised if generic gold bouillon coins and bars also declined 50%.
Very good point. Two different markets, two different types of buyers. According to the Gold Council, first quarter 2012 demand for gold bars was 260.0 tonnes compared to demand for gold coins at 51.3 tonnes. Jewellery demand was even larger at 519.8 tonnes.