April 24, 2024

Gold Advances On Week, Silver Retreats As Financial Crisis II Looms

Gold, platinum and palladium all advanced on the week while silver gave up most of the previous week’s gains.

As measured by the London PM Fix Price, gold gained $7 on the week to $1,540.00 while silver pulled back by $2.50 to $35.19.   Platinum moved up by $21 to $1,807.00 and palladium gained $13 to $770.00.  After the London close, prices of precious metals moved up strongly in New York trading, especially silver, which last traded at $36.39, up $1.20 from the earlier London closing price.

Financial markets worldwide pulled back sharply as the stock traders finally began to acknowledge the fragility of the world’s paper back financial system.  Governments that have borrowed and spent trillions of dollars to stimulate economic growth and support a fragile banking system now find themselves reaching the limits of their borrowing capacity.

It is becoming obvious that the financial crisis of 2008 was just a warm up act to the real financial nightmare that is looming ahead.  Despite trillions of dollars in stimulus spending, coordinated with a money printing campaign by world central banks, the economies of the U.S. and Europe have not recovered.  Unemployment continues to grow, real estate values continue to plunge, debt levels have reached unsustainable levels and real incomes for the majority of workers continue to decline.

There are numerous events that could trigger the second financial crisis  There is no way of knowing which specific event will trigger the next crisis,  nor does it matter.  What does matter is the manner in which Financial Crisis II will be dealt with by world governments and central banks.  Unable to raise taxes or take on trillions more in borrowing, monetary authorities will exercise the last resort option of money printing on a massive scale to avoid a total collapse of the world monetary system.  The gold market is already reflecting this scenario as one of the few safe havens against paper currencies that have little intrinsic value.  When Financial Crisis II gets under way, uninformed talk of a “gold bubble” will quickly disappear as investors will buy gold at any price to preserve their wealth.

Precious Metals Prices
PM Fix Since Last Recap
Gold $1,540.00 +7.00 (+0.46%)
Silver $35.19 -2.50(-6.63%)
Platinum $1,807.00 +21.00 (+1.18%)
Palladium $770.00 +13.00 (+1.72%)

Will platinum, which has lagged the price rallies in other precious metals, start to play catch up?  According to the Wall Street Journal, due to rising production costs for platinum, a price of $2,100 per ounce is necessary to encourage increased mine production.

The historical price ratio of platinum to palladium also suggests that platinum prices could rally significantly.  The Wall Street Journal notes that when palladium reached $860 per ounce in February, the ratio was 2.15 compared to 2.12 today.  The historical average of the platinum/palladium ratio is 3.0 to 4.0, suggesting that platinum is undervalued.
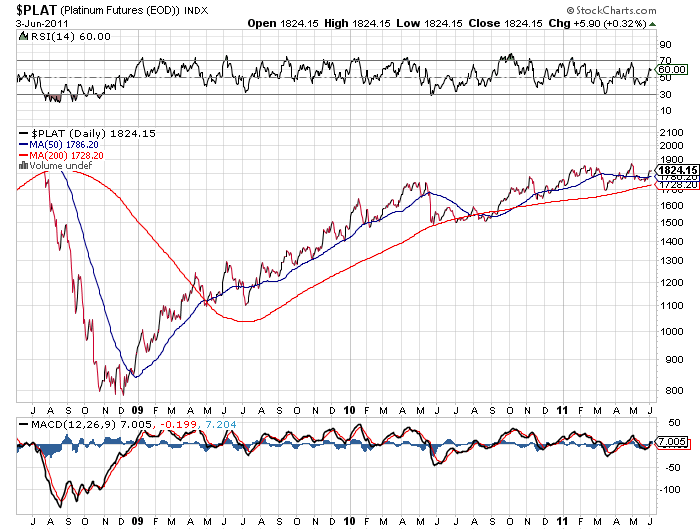
 

PLATINUM - COURTESY STOCKCHARTS.COM

Gold And Silver ETF Holdings Show Little Change On Week

Holdings of the iShares Silver Trust (SLV) were unchanged on the week after dropping by 505.10 tonnes in the previous week.

After extreme price volatility at the beginning of May, silver prices were little changed over the previous week.  Based on the closing London PM Fix price, silver closed at $37.17 on May 25th compared to a closing price of $37.95 on June 1st.

The price of silver has now recovered by 16.7% or $5.45 from the low of $32.50 on May 12.  Silver reached a high for the year on April 28th closing at $48.70.  The price correction should be viewed as a buying opportunity since the fundamentals of the silver market have grown stronger with each passing day.

The debt crisis in Europe and the U.S. appear to be on the verge of spinning out of control.  The latest batch of economic reports show weak employment numbers, decline in the manufacturing sector and a continued collapse in U.S. real estate values.  Economies overburdened by debt desperately require higher economic growth which is simply not happening.  The prospect of continued economic weakness was finally acknowledged by previously bullish stock investors, as sellers pushed the Dow Jones down by almost 280 points for a 2.2% loss.

The latest sales figures from the U.S. Mint indicate that many investors see silver as a better store of value than paper currency.  Total year to date sales through May 31st of the Silver Eagle bullion coins totaled 18.9 million ounces, the most since 1986.  Comparable sales of the Silver Eagle for 2010 were 15.2 million ounces.

U.S. Mint sales of the Silver Eagles during May totaled 3.65 million ounces up from 2.82 million ounces in April.  If sales for the rest of the year continue at the average month’s sales volume, U.S. Mint sales of Silver Eagles would total 45.4 million ounces, valued at over $1.7 billion based on today’s closing price of silver.

GLD and SLV Holdings (metric tonnes)

June 1-2011 Weekly Change YTD Change
GLD 1,212.87 -1.21 -67.85
SLV 9,941.33 00.00 -980.24

The holdings of the SPDR Gold Shares Trust (GLD) decreased by a modest 1.21 tonnes over the past week, after gaining 22.74 tonnes in the previous week.   The GLD currently holds 38.99 million ounces of gold valued at $59.8 billion.  The price of gold gained slightly on the week, closing at $1,533.75, up $7.50 from May 25th.

Precious Metals Stage Impressive Rally – Are Gold Stocks Next?

As measured by the closing London PM Fix Price, precious metals staged impressive gains this week, rallying across the board.  Ongoing concerns about the sovereign debt crisis in Europe, the debt limit ceiling stalemate in the U.S. and a weak dollar all contributed to continued fundamental demand for the metals.

After the London close, precious metals continued to gain in New York trading with gold at $1,537.00, silver at $38.15, platinum at $1,805.00 and palladium at $766.00.

The star of the week was silver which gained $2.89 per ounce for a gain of 8.3% on the week.  Although the correction of silver in early May was dramatic, the sharp pullback has provided long term investors with an opportunity to add to positions.  Silver fundamentals remain strong as detailed in a recent report by the Silver Institute in which it was noted that demand remained robust despite higher prices.  In addition, although higher prices has lead to increased mine exploration and production, new silver production during 2010 rose by only 2.5%.

Precious Metals Prices
PM Fix Since Last Recap
Gold $1,533.00 +42.25 (+2.83%)
Silver $37.69 +2.89(+8.30%)
Platinum $1,786.00 +19.00 (+1.08%)
Palladium $757.00 +23.00 (+3.13%)

Gold has recovered nearly all of its early May price correction and is now only $8 off its high of $1,541.00 as measured by the London PM Fix Price.  The trend in gold remains solidly bullish and any price corrections should be viewed as a buying opportunity.


GOLD - COURTESY STOCKCHARTS.COM


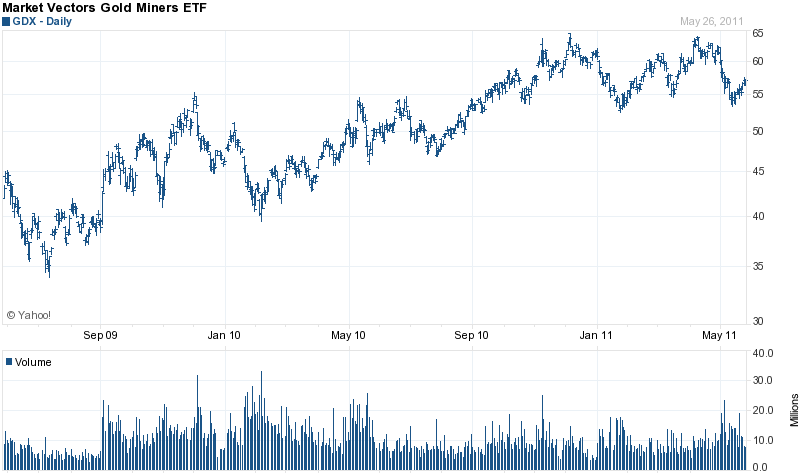
Gold stocks, many of which have trailed the returns of gold bullion, may also be viewed as attractive at this point. As measured by the Market Vectors Gold Miners ETF (GDX),  gold stocks are moving up after making multiple bottoms at the $55 support level.


GDX - COURTESY YAHOO FINANCE

Many of the gold mining stocks are selling at steep discounts to their gold reserves and represent solid values. Earlier this week, Kinross Gold, which sells at the equivalent of $250 per ounce, was a featured story. Value investor David Steinberg of DLS Capital Management, has a price target on Kinross of $27 per share. Kinross closed today at $16.11.

How Wall Street Pros Made Huge Profits On Silver ETF Crash As Small Investors Sold

The holdings of the iShares Silver Trust (SLV) declined by a substantial 505.10 tonnes from the previous week.  The decline in SLV silver holdings from the all time high of 11,390.06 tonnes reached on April 25th comes in at a hefty 1,448.73 tonnes or 12.7%.  Silver, meanwhile, has declined in price by $8.31 per ounce or 18.3% since April 25th.

Although the price per share of the SLV tracks the price per ounce of silver very closely, the actual bullion holdings of the SLV can fluctuate, sometimes dramatically, from the underlying price movements of silver.  This same situation applies to the SPDR Gold Shares (GLD).

The reason why the physical holdings of the SLV and GLD do not closely track the price of gold and silver is due to the complex mechanism by which Authorized Participants can “create or redeem” shares in the SLV and GLD.  The silver and gold trusts are structured to allow large Wall Street investment firms to act as Authorized Participants to arbitrage against a premium or discount of the SLV or GLD share prices to the underlying net asset value of the Trusts.

Premiums or discounts to the net asset value of the Trusts occur based on normal supply and demand by investors during the course of trading in SLV and GLD shares.  The Authorized Participants routinely reap profits from their arbitrage activities based on the prevailing discounts or premiums .  According to the prospectuses of the GLD and SLV, the Trusts were structured in this manner to allow the price of the GLD and SLV shares to closely correspond to the underlying value of gold and silver bullion.

The Trusts do not directly buy or sell bullion based on investor buy or sell orders for the SLV and GLD.  The Trusts are not structured like a typical mutual fund which liquidates its holdings if there is a surge of investor redemptions.  Changes in the number of Trust shares outstanding and changes in holdings of gold and silver occur only based on the creation or redemption of shares through Authorized Participants.

Premiums or discounts of the SLV and GLD shares to net asset values are normally less than 1% but can expand dramatically when trading is volatile.  For example, on May 2nd, when silver prices were plunging, the shares of the SLV reached a huge discount of 9.87% from the net asset value of silver held by the SLV Trust.  Investors desperately seeking to liquidate their SLV shares caused the value of the SLV to trade at a steep discount to the underlying net asset value of the Trust.

At this point the lucky Wall Street pros who act as Authorized Participants were gladly buying the SLV shares and simultaneously shorting silver bullion, locking in huge profits.  Authorized Participants who arbitraged during this volatile trading profited greatly at the expense of panicky SLV sellers who sold shares of the SLV at $42.79 that were worth $47.51 based on the net asset value of the SLV.  (Pricing data on the SLV share discount was obtained from the iShares Silver Trust web site).

The Authorized Participants who bought SLV shares during the panic sell off then delivered their SLV shares to the iShare Trust and requested that they be redeemed for silver bullion which was then used to close out short positions in silver bullion.  Under this situation, the silver bullion holdings of the SLV decreased since they delivered silver bullion to the Authorized Participants in exchange for redeemed SLV shares.  This is exactly the situation that has occurred during the May silver sell off and it is therefore no surprise that the holdings of the SLV have plunged.

The average investor in the iShares Silver Trust would be hard pressed to understand the “creation and redemption” features of the SLV shares.  Although the SLV can be an easy way for an investor to participate in silver bullion ownership, my investment thesis is to avoid investments that cannot be fully or easily understood.

For investors seeking to establish investments in gold and silver without having to hold the physical metal, the Sprott Physical Gold Trust (PHYS) or the Sprott Physical Silver Trust (PSLV) offer better opportunities.  Both of these Trust hold specific amounts of physical gold or silver which do not change.  Each share holder has an unallocated interest in the precious metals held by the Trust.

All precious metal holdings of the Sprott Trusts are secured not by a bank, as with the GLD, but by the Royal Canadian Mint of the Canadian Government which is responsible for any loss or damage .  The gold or silver backing the Sprott Trusts are specifically allocated by the Mint to the Sprott Trusts.

From a total investment return standpoint, it is also important to note that the shareholders of the PHYS and PSLV are taxed at the capital gains rate of 15% (if held for more than one year) whereas shareholders of the GLD and SLV are taxed at 28%.  For further information see Sprott Physical Gold Trust Advantages Over SPDR Gold Shares Trust.

GLD and SLV Holdings (metric tonnes)

May 25-2011 Weekly Change YTD Change
GLD 1,214.08 +22.74 -66.64
SLV 9,941.33 -505.10 -980.24

Holdings of the SPDR Gold Shares Trust (GLD) increased by a modest 22.74 tonnes from the prior week to 1,241.08 tonnes.   The GLD held 1,280.72 tonnes at the beginning of the year.  The all time record holdings were reached on June 29, 2010 at 1,320.47 tonnes.  The GLD currently holds 39.0 million ounces of gold bullion valued at $59.6 billion.

Gold And Silver ETFs Show Modest Decline In Holdings

The holdings of the iShares Silver Trust (SLV) declined slightly on the week by 53.10 tonnes as silver prices continued to consolidate after the sharp sell off of early May.
Since the beginning of the year, holdings have declined by 434.19 tonnes to the current level of 10,540.48 tonnes.  The all time record holdings of the SLV were 11,390.06 tonnes on April 25th, as the price of silver was approaching the $50 per ounce level.

Even after the early May pullback, silver has rewarded investors with a gain of 29.7% from the January low of $26.68.  The SLV has delivered a total return of 115.4% over the past year, and an average 25.8% yearly return since its inception in April 2006.

Despite the downturn in ETF holdings, there is strong evidence of continued strong fundamental demand for silver:

  • The U.S. Mint continues to ration sales of silver bullion coins, as total production cannot meet full market demand. This has led to higher premiums for American Silver Eagles and the newly introduced America the Beautiful Silver Bullion coins.
  • Dealers are reporting continued high demand for silver bullion as an increased number of new investors seek to protect their wealth by diversifying out of paper currency and existing investors use the reduced prices to increase holdings.
  • Investor demand for physical gold and silver is growing dramatically in countries such as India.  According to the Financial Times, silver traders in India report that “People are booking incredible amounts of Silver as they see the current drop in prices as a great opportunity to buy more…most are buying for pure investment.”

Meanwhile, the cheap money policies of the Federal Reserve are not likely to change any time soon.  Minutes of the last Fed meeting on April 27-28th, indicate that the Fed extensively discussed an exit strategy from its easy money policies but provided no guidance on timing.  Most analysts have concluded that it may be years before the Fed actually starts to tighten monetary policy.

GLD and SLV Holdings (metric tonnes)

May 18-2011 Weekly Change YTD Change
GLD 1,191.34 -9.70 -89.38
SLV 10,540.48 -53.10 -434.19

Holdings in the SPDR Gold Shares Trust (GLD) declined slightly on the week by 9.7 tonnes.  It was disclosed this week that investor George Soros sold 4.7 million shares of the GLD during the first quarter, bringing his holdings down to a token 49,400 shares.  The liquidated shares were valued at $684 million based on today’s closing price of the GLD.  The 4.7 million shares of GLD represented only approximately 15 tonnes of gold or 1.2% of total GLD holdings.

Was Soros turning negative on gold, as suggested by the media, or was Soros simply taking some short term profits?  While Soros was selling, legendary hedge fund manager John Paulson did not reduce his massive stake of $4.4 billion in the GLD.  Although Soros has a great long term track record, during the financial panic of 2007-2008, he bought Countrywide and Lehman Brothers shortly before they collapsed.  Perhaps history will repeat and the sale of gold by Soros will mark a major bottom in the gold market.

The long term uptrend in gold is still intact and supported by the fundamentals (see Insights From A Legendary Gold Investor).   Since the SPDR Gold Shares inception date of November 12, 2004, the fund has had a spectacular annual average return of 19.6%.  The GLD currently holds 38.3 million ounces of gold valued at $57.3 billion.


US Mint Gold Bullion Sales Set Rapid Pace

The recent declines in precious metals seem to have shifted some investors preferences. For the current month to date, US Mint sales of gold bullion sales are on pace for the highest levels of the year, while silver bullion sales remain at typical levels.
From their peak prices reached in late April, silver has declined by about 32% while gold has declined by a modest 6%.

In the past week, the US Mint has sold 15,500 troy ounces of gold bullion coins, comprised of 11,000 ounces of American Gold Eagles and 4,500 ounces of American Gold Buffaloes. Monthly totals are now 89,000 and 9,500 ounces respectively. These figures reflect sales through May 16, 2010.

US Mint Bullion Coin Sales for Week Ending 5/16/2011 (troy ounces)

Gold Eagle 11,000
Gold Buffalo 4,500
Silver Eagle 756,500
Silver ATB 15,000

Silver bullion products, which remain subject to rationing, sold a combined 771,500 troy ounces in the past week. This consisted of 756,500 ounces worth of American Silver Eagles and 15,000 ounces worth of the 5 ounce America the Beautiful Silver Bullion Coins. For the latter product, the US Mint has now sold all of the available coins for the first two designs of the year featuring Gettysburg National Military Park and Glacier National Park. An additional 126,700 coins (633,500 troy ounces) featuring the Olympic National Park design will go on sale to authorized purchasers on May 23, 2011.

US Mint Bullion Coin Sales for Year to Date (troy ounces)

Gold Eagle Gold Buffalo Silver Eagle Silver ATB
January 133,500 6,422,000
February 92,500 3,240,000
March 73,500 38,000 2,767,000
April 108,000 20,500 2,819,000 1,127,000
May 89,000 9,500 2,177,500 140,000
Total 496,500 68,000 17,425,500 1,267,000

For the year to date, silver bullion coin sales have reached 18,692,500 troy ounces. Last year, the US Mint had sold 35,487,500 ounces across the two available silver bullion coin programs.

Gold bullion coin sales have reached 564,500 ounces for the year to date, compared to 1,429,500 for the prior year.


Silver And Gold ETFs Stable – Bank Savings vs. Precious Metals and How Much Is a Trillion?

As the silver market stabilized after last week’s sell off, holdings of the iShares Silver Trust (SLV) increased by 153.22 tonnes over the past week.

Since the beginning of the year, the SLV holdings have declined by 381.09 tonnes, but the largest decrease in holdings tracks the silver sell off that began in late April.  From a record high holding of 11,390.06 tonnes of silver on April 25th, the SLV has seen a decline in holdings of 849.58 tonnes.   The reduction of holdings since April 25th exceeds the amount of silver originally held by the SLV at its inception in April 2006 when it held 653.17 tonnes.

One indication of the amount of forced selling that occurred last week is reflected by the premium/discount on the SLV compared to its net asset value.  On April 25th, when the SLV had peak holdings and silver was surging towards the $50 level, the premium on SLV shares was 1.48%.  Investors at that point were paying $45.83 per share while the SLV’s net silver assets were $45.14.  Two days later and trading at very high volume, investors paid $47 per share for the SLV which held silver worth $44.20, a fat premium of 6.29%.

The first week of May saw a steep price decline in silver caused, in large part, by five margin increases by the COMEX on silver futures trading (see How The Comex Crashed The Silver Market).  Forced selling of the SLV resulted in huge discounts from net asset value.  On May 2nd, the discount on the SLV reached a huge 9.87% and sellers of the SLV were receiving only $42.79  for shares with a net asset value of silver worth $47.51.  On Monday and Tuesday of this week, pricing became orderly with only a minor difference between net asset value and market value of the SLV.

The SLV currently holds 338.9 million ounces of silver valued at $13.3 billion.  Despite the recent sell off, silver has had a spectacular performance this year.   From its January low of $26.68 to its closing New York spot price on May 11th of $35.27, silver has risen by 32%, proving the case for diversification into precious metals.

By contrast, savers of paper currency in banks have been treated to returns of virtually zero, courtesy of Ben Bernanke’s zero interest rate policies.  As the public wakes up to the fact that their paper currency savings are becoming worth less and less, the demand for both gold and silver should increase exponentially.

GLD and SLV Holdings (metric tonnes)

May 11-2011 Weekly Change YTD Change
GLD 1,201.04 -18.90 -79.68
SLV 10,540.48 +153.22 -381.09

Holdings of gold by the SPDR Gold Shares Trust (GLD) declined by 18.90 tonnes on the week.  The GDL currently holds 38.6 million ounces of gold valued at $58.2 billion.

How Much Is A Trillion?

Sometimes a very routine event can open your eyes and keep you on the right long term track.  Last week I was having breakfast in Mexico and casually put a tip of a couple of U.S. dollars on the table.  (Yes, they still take our paper money in Mexico).   Gazing at the paper dollars I reflected on how, as a child, two hours of working odd jobs for neighbors would earn me two dollars.

Then, I tried to figure out how big the table would have to be to hold the $2 trillion dollars printed out of thin air by the Federal Reserve over the past couple of years.   At this point, my wife started getting annoyed with me, so I gladly restrained myself from an academic exercise that was fruitless anyways.   How many people can comprehend a trillion dollars?  Not me, but I know it’s a crazy large amount.  I also know that anything that can be produced in the trillions at virtually no cost cannot have any real long term fundamental value.  And that’s all I really need to know to make me indifferent to a short term sell off in the gold and silver markets.

Silver ETF Holdings Plunge As Market Selloff Continues, Gold ETF Holdings Show Small Decline

The amount of silver held by the iShares Silver Trust (SLV) plunged over the past week as the silver market experienced a major sell off.

Holdings of the SLV declined by 665.94 tonnes on the week.  To appreciate the magnitude of this decline, consider that the total silver  holdings of the SLV at its inception in April 2006 was 653.17 tonnes.  In addition to this week’s reduction in silver holdings, the SLV saw a drop of 130.49 tonnes in the prior week.

Holdings of the SLV had recently hit a record high of 11,390.06 tonnes on Monday April 25 as prices soared towards all time highs near $50 per ounce.  Silver held by the SLV Trust has declined by 1,002.8 tonnes or 8.8% from the record high, bringing holdings back to the levels reached on February 10th of this year.

The SLV currently holds a total of 334 million ounces of silver valued at $13.5 billion.  After recently reaching a high of $48.35 the SLV sold off sharply, closing yesterday at $38.27.  The SLV has declined by 21% from its all time high reached five trading days ago on April 28th.

GLD and SLV Holdings (metric tonnes)

May 4-2011 Weekly Change YTD Change
GLD 1,219.94 -9.70 -60.78
SLV 10,387.26 -665.94 -534.31

A multitude of factors, both fundamental and technical were cited for the sharp decline in silver prices including:

  • Five margin increases on silver futures contracts, including two new ones announced on May 4th by the COMEX.
  • Liquidation of silver holdings by a hedge fund run by George Soros.
  • Excessive speculation in silver as indicated by huge volume in SLV trading.
  • Manipulation of the gold and silver markets by large players with short positions..
  • A very overbought market described by some as a “religious fervor” for silver.
  • Profit taking at the technically significant level of $50 per ounce, last reached in 1980.
  • The end of QE2 announced by the Fed last week.
  • Huge record volume in silver futures trading.

In any event, silver has become significantly cheaper in the past week and the fundamental reasons for owning precious metals remain intact (see Why There Is No Upside Limit For Gold and Silver Prices).  Long term investors should welcome the shakeout of day traders and speculators from the silver market and view this as a buying opportunity.

Holdings of gold by the SPDR Gold Shares Trust (GLD) declined modestly by 9.7 tonnes.  Current gold holdings of the GLD amount to 39.2 million ounces valued at $60.4 billion.

The inability of politicians to seriously address the budget deficit and ballooning national debt provide a compelling reason to diversity out of the U.S. dollar and into precious metals.   The dollar is close to all time lows as numerous countries announce their intention to diversify out of dollars to protect their wealth.  The disclosure that Mexico had significantly increased its gold reserves this year highlights the flight from paper currencies.  Based on the fundamentals, long term investors should view a correction in precious metal prices as an opportunity to add to positions.

US Mint Gold and Silver Bullion Coin Sales By Month

Through the end of April, the United States Mint has now sold 466,000 ounces of gold and 16,375,000 ounces of silver through its bullion coin programs. In both cases the figures are far ahead of the numbers from the comparable year ago period, despite the higher market price per ounce for the bullion.

Last year through the end of April, US Mint gold bullion sales were 388,000 troy ounces, while the price of gold ranged from a low of $1,058.00 to a high of $1,179.25 per ounce. Silver bullion sales during this period were 11,531,000 with the market price ranging from a low of $15.14 to a high of $18.84 per ounce.

US Mint Gold and Silver Bullion Sales (in ounces)

January February March April Total
American Gold Eagle 133,500 92,500 73,500 108,000 407,500
American Gold Buffalo 38,000 20,500 58,500
Total Gold in ounces 133,500 92,500 111,500 128,500 466,000
American Silver Eagle 6,422,000 3,240,000 2,767,000 2,819,000 15,248,000
ATB Silver 1,127,000 1,127,000
Total Silver in ounces 6,422,000 3,240,000 2,767,000 3,946,000 16,375,000

During the latest month of April 2011, the US Mint recorded sales of 128,500 troy ounces of gold bullion, comprised of 108,000 ounces worth of American Gold Eagles and 20,500 ounces worth of American Gold Buffaloes.

Meanwhile, silver bullion sales for the latest month reached 3,946,000 ounces, the second highest level of the year. For three months running, the pace of sales for the American Silver Eagles had remained approximately the same base level, despite indications of higher demand. The restrained sales are presumably the impact of the US Mint’s allocation program, which rations the available number of bullion coins amongst the authorized purchasers.

The boost in silver bullion sales seen in April was due to the release of the 2011-dated America the Beautiful Silver Bullion Coins. These coins each contain five troy ounces of silver and have a diameter of 3 inches. Sales began on April 25, 2011, and authorized purchasers immediately purchased coins accounting for 1,127,000 troy ounces of silver.

Silver and Gold ETF Holdings Decline Amidst Volatile Trading

In a week of volatile precious metals trading, holdings of both the iShares Silver Trust (SLV) and the SPDR Gold Shares Trust (GLD) saw modest declines.
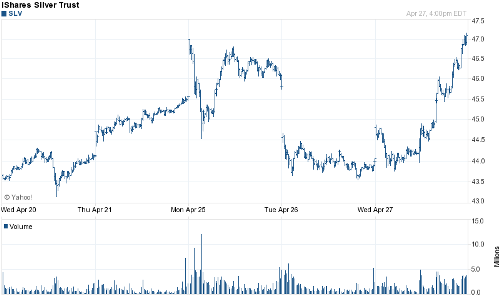
The holdings of the SLV declined by 130.49 tonnes or 1.2% from last week to 11,053.20 tonnes.  Looking at the daily changes, however, provides a a better indication of the volatility in SLV holdings during the week.

The holdings of the SLV hit an all time record high amount of 11,390.06 tonnes on Monday April 25th.  The substantial decline of 336.86 tonnes over the following two days mirrors the volatile price action of the SLV, which declined more than $2 on Tuesday before recovering to all time  highs at Wednesday’s closing price.

SLV - COURTESY YAHOO FINANCE

The SLV currently holds 355.4 million ounces of silver valued at $16.1 billion.  The SLV is currently the largest silver ETF and has seen tremendous growth in holdings since the Trust’s inception in April 2006, when it held a mere 653.17 tonnes valued at $263.5 million.  According to the Silver Institute, at the end of the first quarter 2011, total holdings held by all silver ETFs was 612 million ounces.

Despite the tremendous appreciation of the SLV, the silver market remains a relatively small market which leads to speculation that silver prices are being manipulated.  Volatility in silver trading over the past week was enhanced by rumors of massive short positions by traders, attempts to corner the market by larger players, and the inability to deliver physical silver on futures contracts.

The recent volatility in silver is likely to continue as additional players are drawn into one of the hottest markets of 2011 and wide price swings may become the norm over the short term.

For long term  investors, the fundamentals of the silver market should overweight any short term volatility.  Sales of Silver Eagles by the US Mint in the first quarter of 2011 was 37% higher than the previous year reflecting continuing investor demand.

GLD and SLV Holdings (metric tonnes)

April27-2011 Weekly Change YTD Change
GLD 1,229.64 -0.61 -51.08
SLV 11,053.20 -130.49 +131.63

Gold holdings in the GLD declined modestly by 0.61 tonnes after an increase of 17.29 tonnes for the previous week.  The current holdings of the GLD amount to 39.5 million ounces of gold valued at $59.7 billion.

Gold hit another all time high today, recently trading at $1,531.  The Federal Reserve ignited a sharp rally in gold and silver after releasing details of this week’s FOMC meeting. The precious metal markets moved higher after the Federal Reserve said it would continue super aggressive monetary policies despite the June wind down of QE2.  The Fed indicated that it would not reduce the size of its balance sheet and would leave short term interest rates at zero.

The Fed also left the door open to future unconventional policy moves if deemed necessary.  Since the Fed cannot move rates below zero, any additional “unconventional easing” would almost certainly mean additional money printing by the Fed.   The US dollar traded lower on Fed comments and is now threatening to break to new all time lows.